ICM, Wk 10: Final Project Ideas
Interested in continuing to explore idea of labor in relation to new technology…but possibly something else as well.
IDEA 1:
Animated essay/story:
Write/find an essay on a subject and have it be formatted across multiple pages, with different interactions, animations, and easter eggs built-in to the pages and text.
Could involve expanding, cleaning up video project and data center API homework
I could do this in relation to new technology labor practices and use some of the work mentioned above. Another possible topic I’ve been wanting to make work about connects ideas and realities of affect theory (emotional labor, often female), walmart (?), smiles, single mothers, and low wage labor.
![]()

![]()
IDEA 2:
New cooperative interpretation of Uber mobile app

Re-design/re-conceptualize Uber as a cooperative structured company. Already thinking about labor, going to this reading, where I came across this quote:
As for the user’s experience, alternative, open-source platforms would have to rival the habit-creating seductiveness of Uber. Cute penguins are no longer sufficient. Every Uber has an Unter, and the interface of platform-coop apps could instruct users about fair labor standards and the failing social protections in the “sharing economy.” Such platforms could give a face to the cloud workers who are — for all practical purposes — anonymous, isolated, and tucked away between algorithms.
(my emphasis)
IDEA 3: [totally different]
Get every-day slot-machine poem generator up and running, fully functional.
PComp, Wk 8: Final Project Ideas
I can’t say that I have anything concrete in mind for a final project. No sketches or drawings to speak of and try as I might…I can’t picture what I want to do.
Part of it comes from a frustration at the growing presence of tech in our lives and not wanting to add to the noise. I am reminded, however, of the ***one reading we had*** that talked about moving away from designing objects to designing experiences.
Now, this is a realm I feel more comfortable in. But again, I wonder, what kind of experience do I want people to have?
Part of it is that the ideas that absorb my mind at the moment have a lot to do directly with the internet and technology. My past two ICM homeworks have been on the theme of visualizing different “unseen” aspects of the internet – from cloud computing, to the people who labor to bring us our online experiences.
How can we better visualize and play with the various forces that make up our current relationship to technology?
(Could it somehow be related to periscoping with people in these locations who might know people who perform this work?)
The predictive nature of technology is fascinating. With all of this “big data” and carefully written algorithms, apparently people can predict with startling accuracy how likely a person will end up in a hospital based on their internet search history. Prediction is a kind of occult practice, within the realm of palm readers and tarot card decks. This plays well with the metaphors of technology as magic (even Nancy says this is Hogwarts). There might be something fruitful in connecting this idea to the way that these jobs and actions are often associated with women, and the growing interest among young women in witch culture.
Honestly, just spit ballin.
PComp, Wk 7: Midterm
This post is essentially a reconstruction of the notes that I took throughout the development process of our midterm, with some documentation photos/videos thrown in.
Our initial idea was to design an experience that used tactile materials, thinking about how pleasing it can be to run your hand through sand, for example. After looking through a couple of projects that used sand, we found one that used a speaker to shift sand around a plate.
So rather than have a human shift a material around to create an output, we thought of the human giving some kind of input that would cause an effect on the sand. Ruta and I agreed that sound was an interesting medium, as neither of us had worked with it before. We recalled the tone output lab and wondered how different frequencies/tones would act upon sand. This was also an important lesson for me, since I didn’t realize up until this point that frequency and tone were the same thing. Or that, each tone has it’s own unique frequency. COOl. First lesson of the project. So we wondered, could we get the sand to behave in different ways based on the frequencies/tones we played?
In our first iteration, we built a four note keyboard that plays different frequencies of the note C going from low to high.
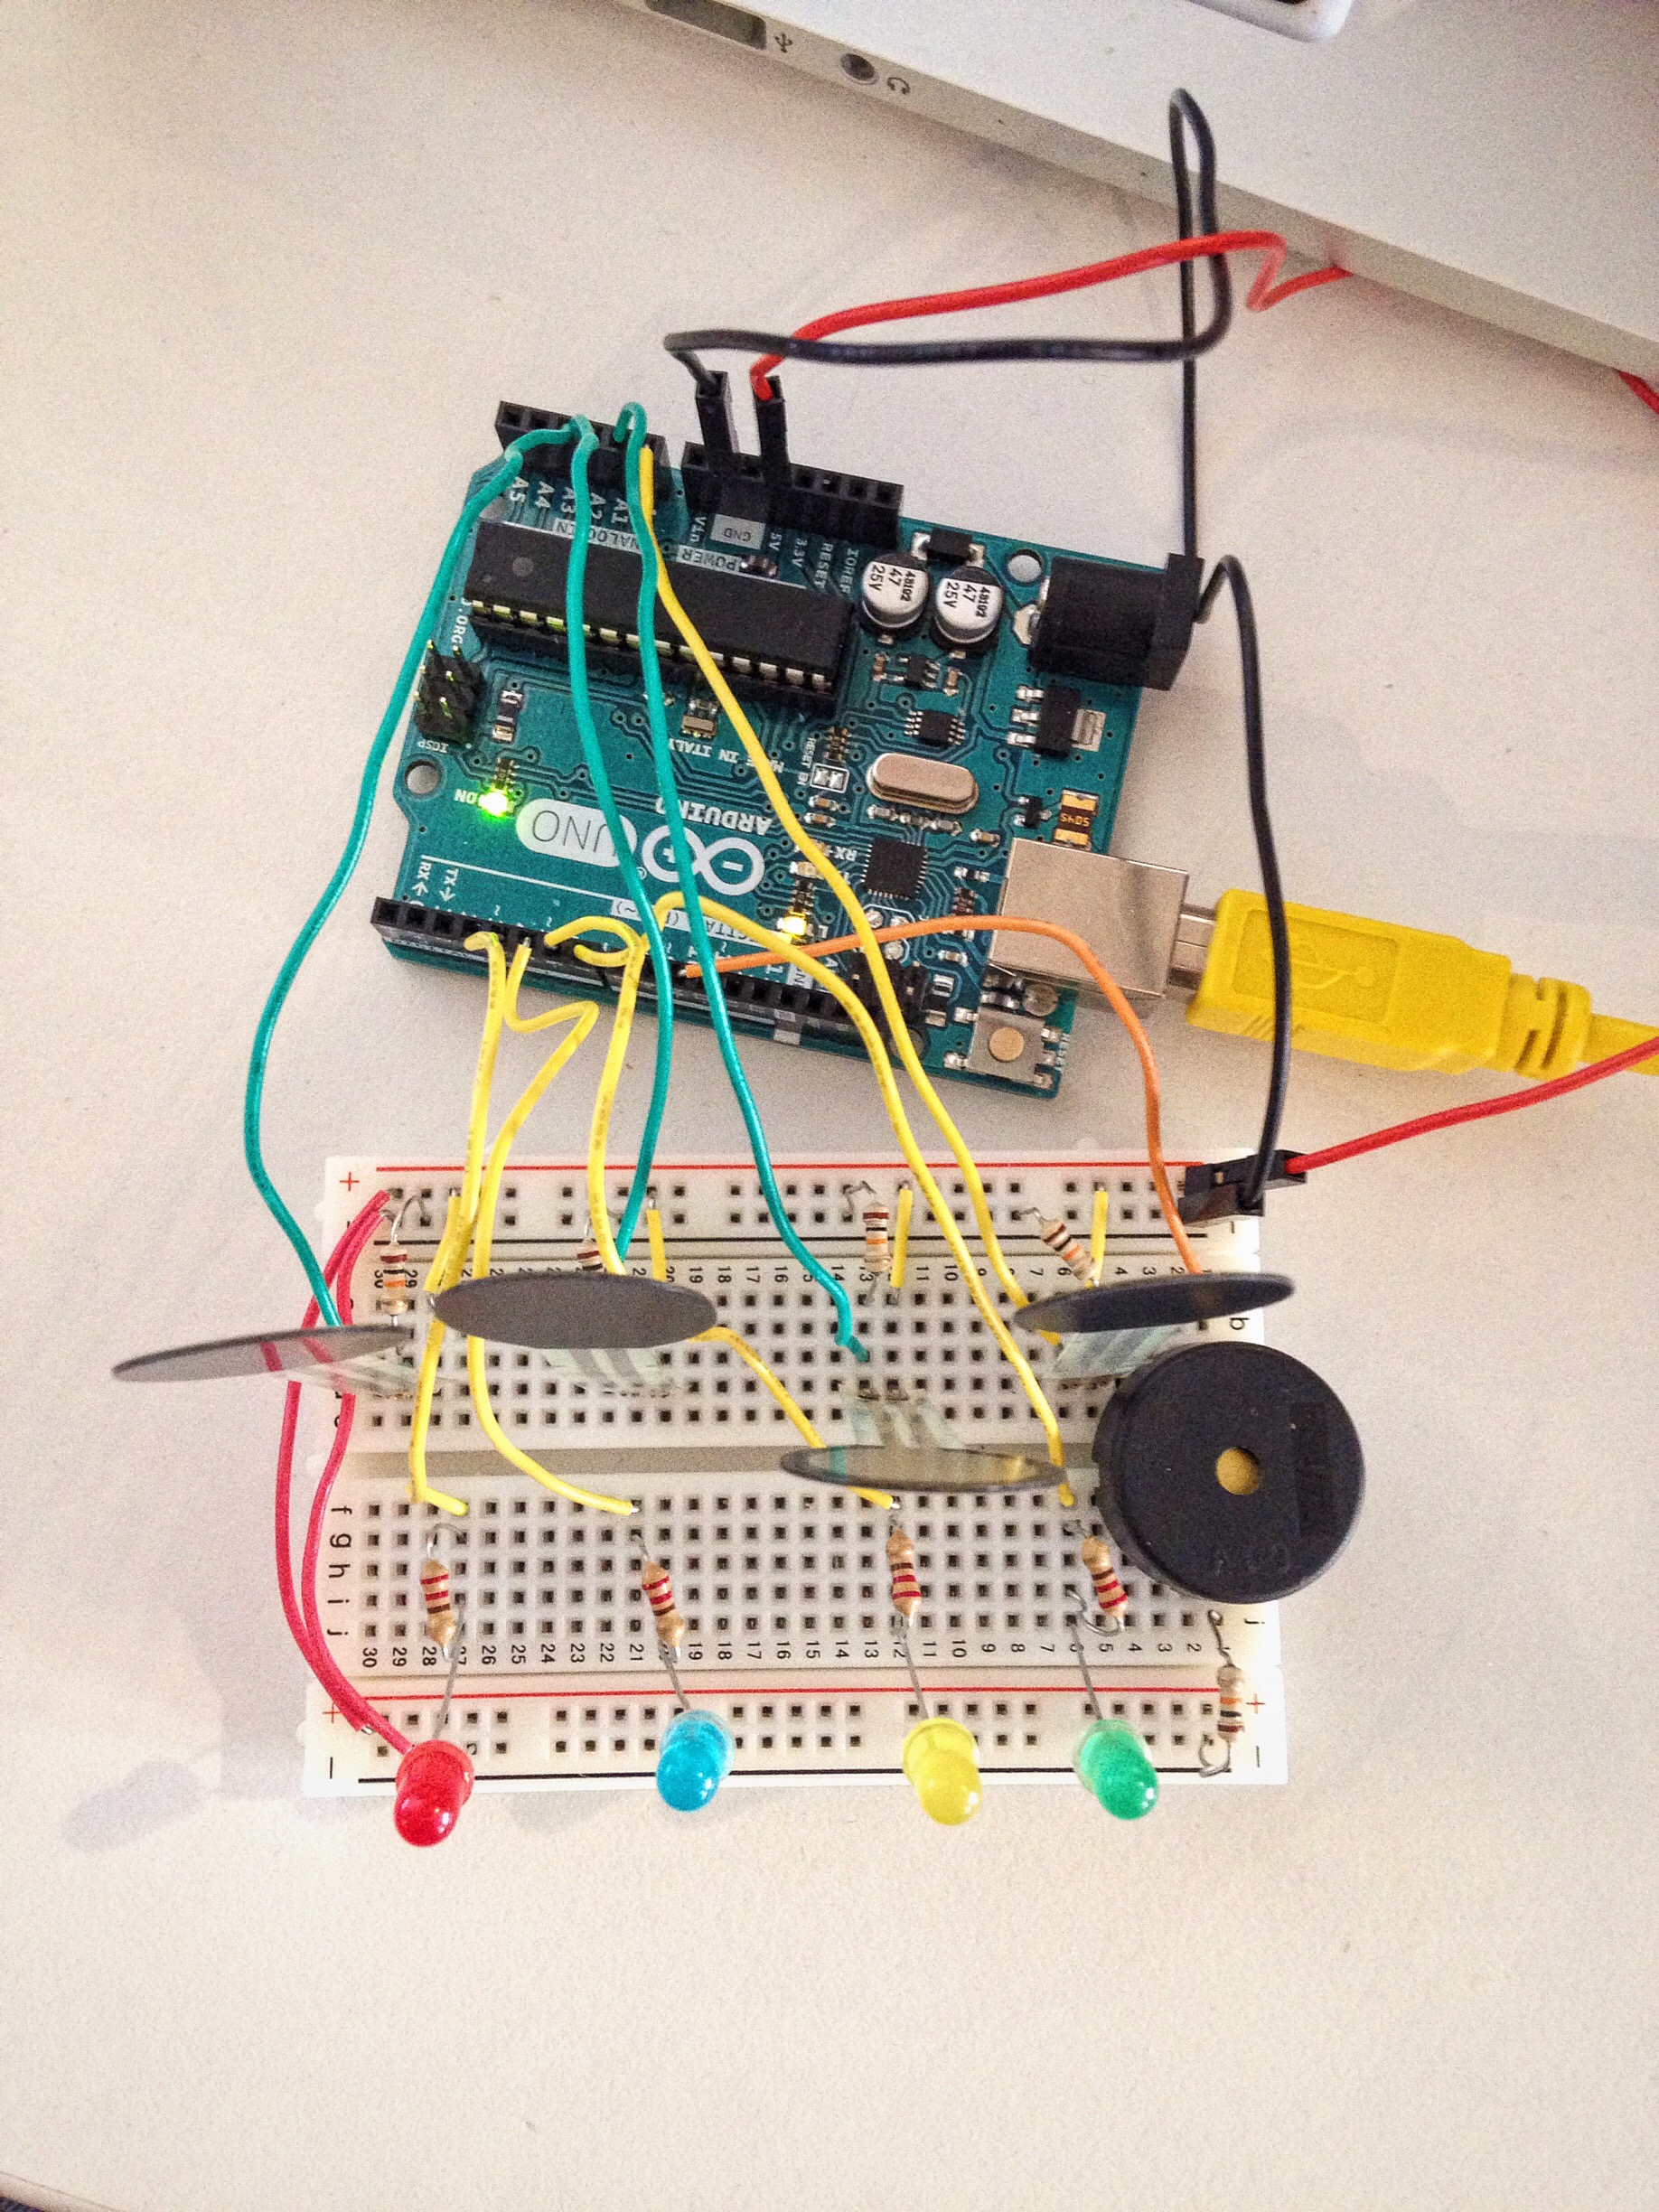
Ruta’s photo of the breadboard
We then hooked up four LEDs corresponding to the four FSRs. We thought the LEDs would act as additional feedback to the user, so they would know when they had initiated a new frequency. We also played with having a different range of tones from low to high. Initially, we had some difficulty getting the LEDs to correspond with the correct notes – they would stay on even if their corresponding FSRs was no longer being held. We realized we had brightness as local variable and wondered if changing it to a global variable would do the trick, and it did.
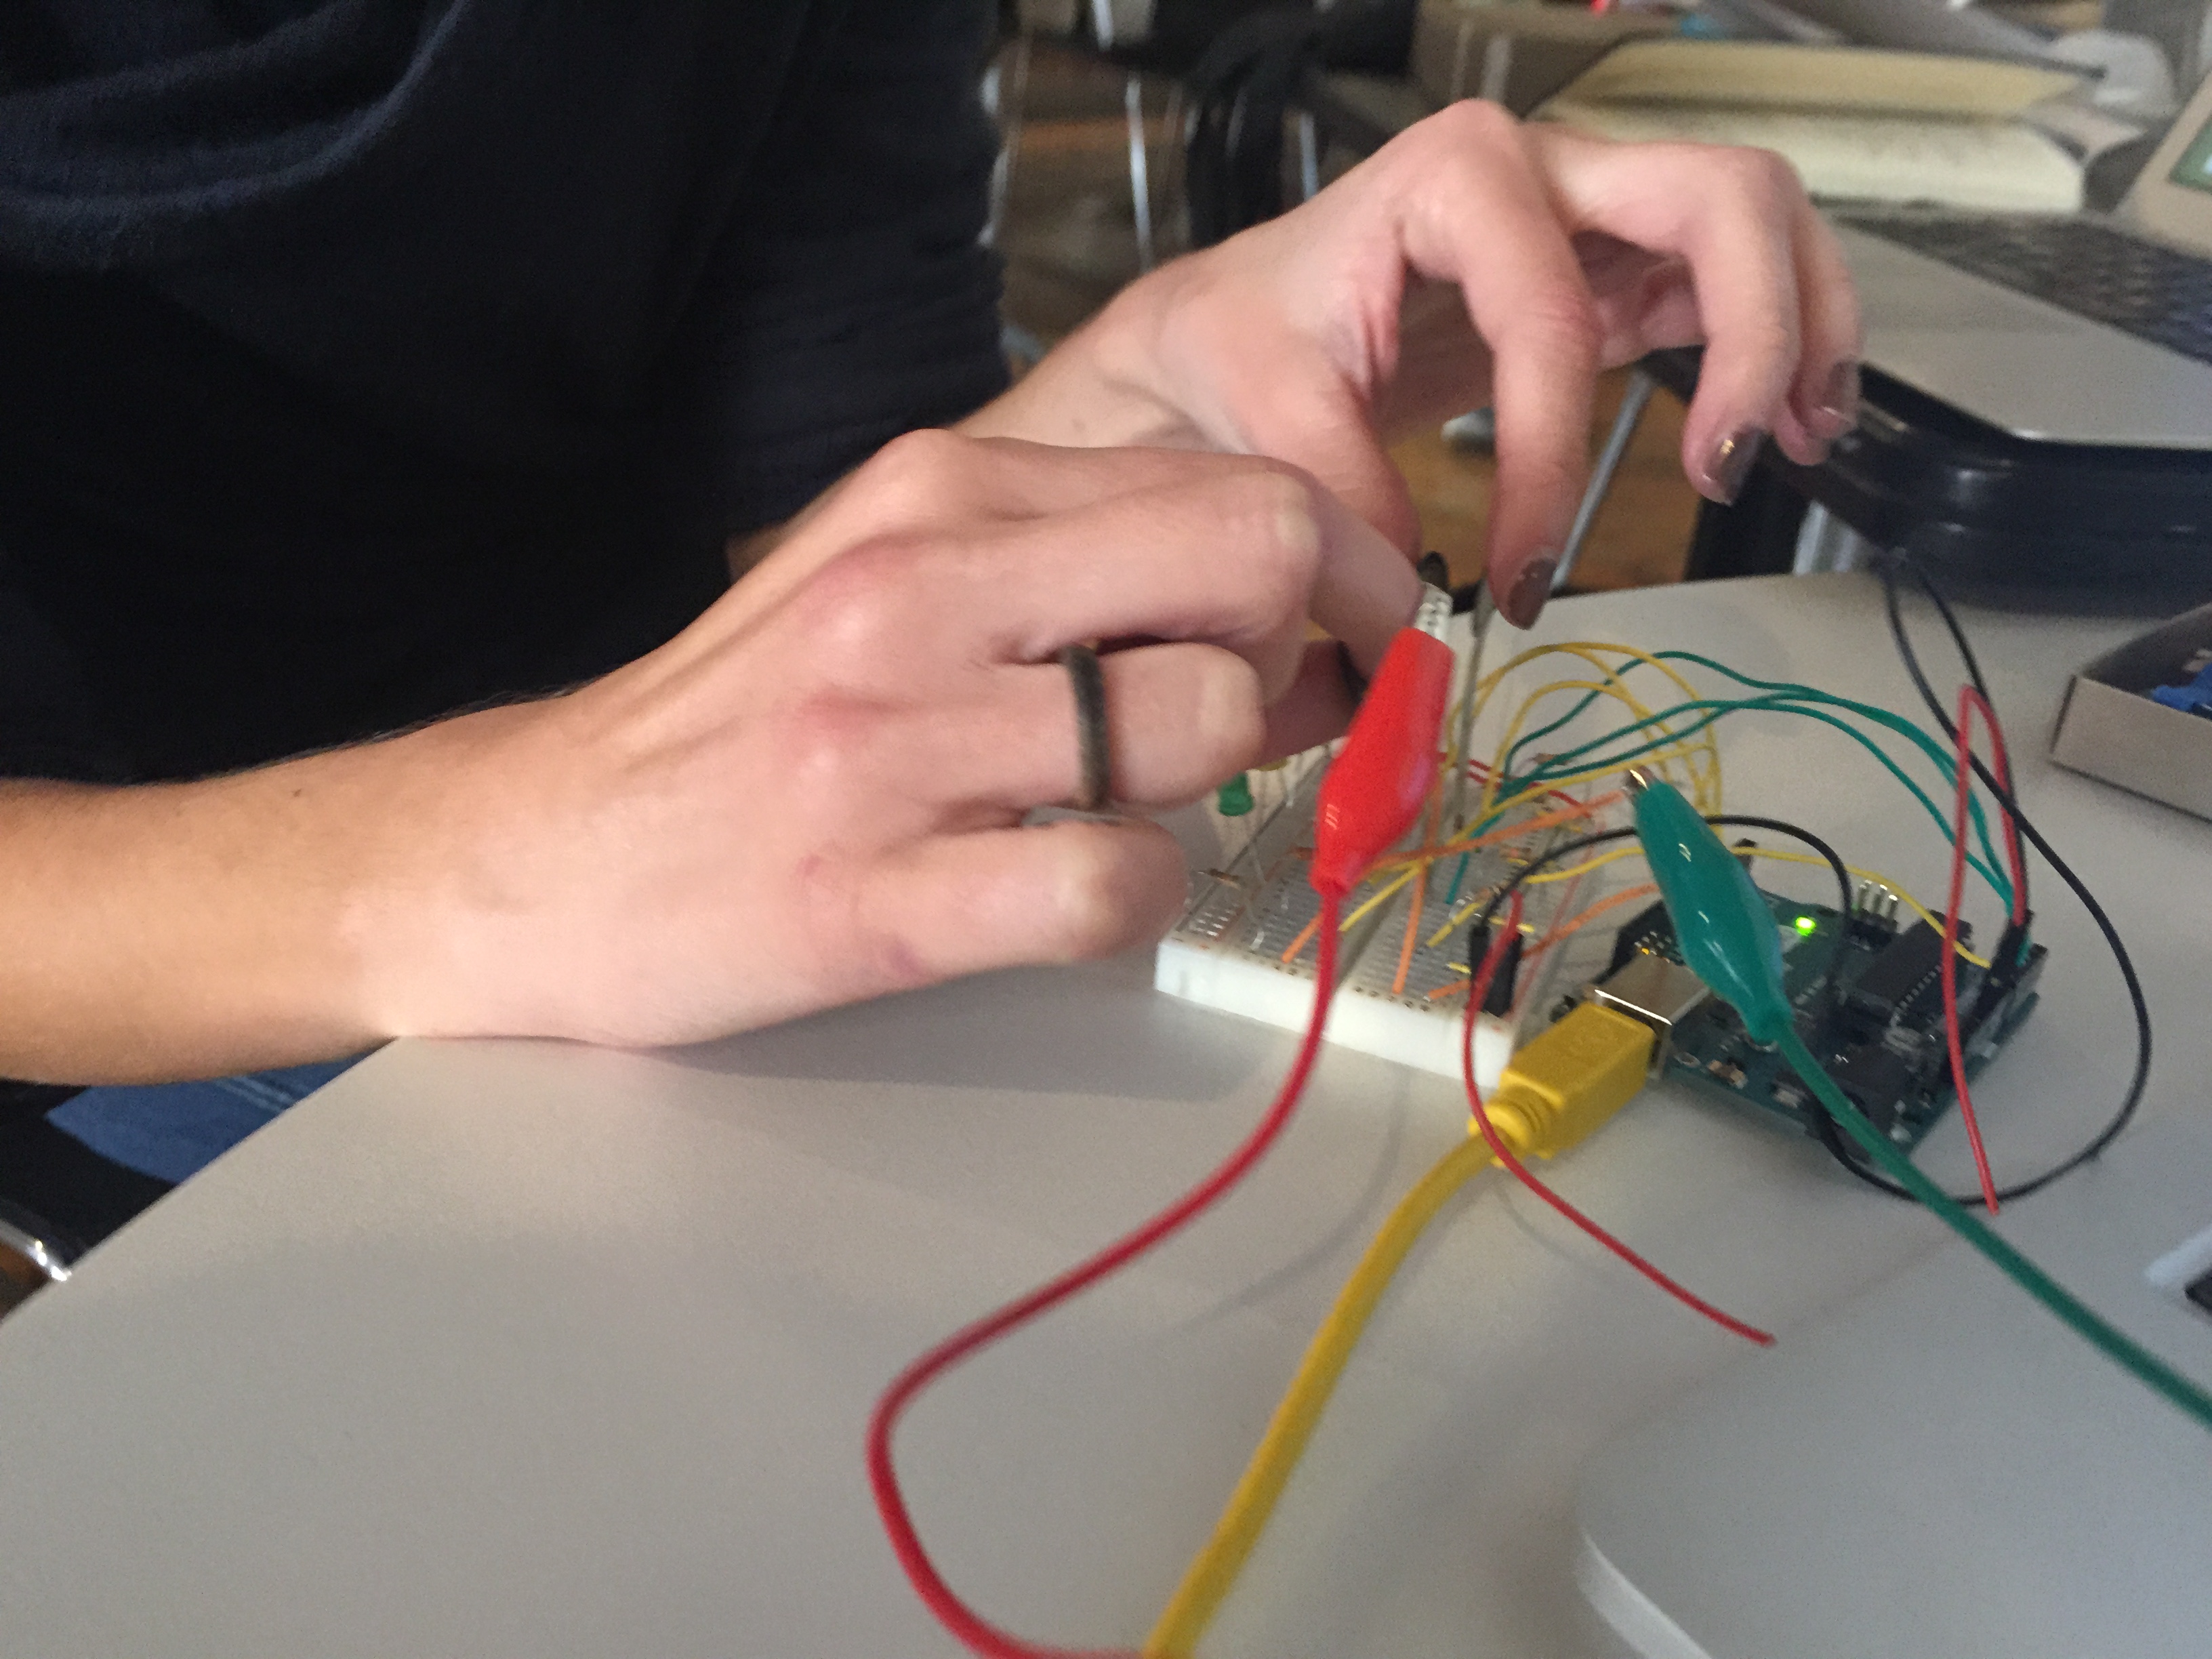
At this point we’d been simply playing tones from one of the small speakers hooked up to the breadboard. After some second-year assistance, we got a much larger speaker from the ER hooked up (glad I bought those alligator clips). Now we’re cookin’ with gas.

a plate did not work well
At this point we tried out a couple of different surfaces and a few different materials. The thicker the surface, the harder it was to get the frequency waves to penetrate and cause movement amongst the particles. Also, the smaller the particles, the more easily they would move and move together.
IMG_4580 from Zoe Bachman on Vimeo.
IMG_4584 from Zoe Bachman on Vimeo.
Then a friend showed us a video of a Chladni plate and we decided we would try and do something similar. Since we’d been successful at getting the particles to move in different ways based on the tones we played, we liked the idea of the added challenge of achieving these specific patterns.
We met with TK, who answered several questions we had, such as what size speaker to use. We also learned more about the p5.js sound library and how we could use serial communication to output sounds rather than continuing to use the tone program on the arduino.
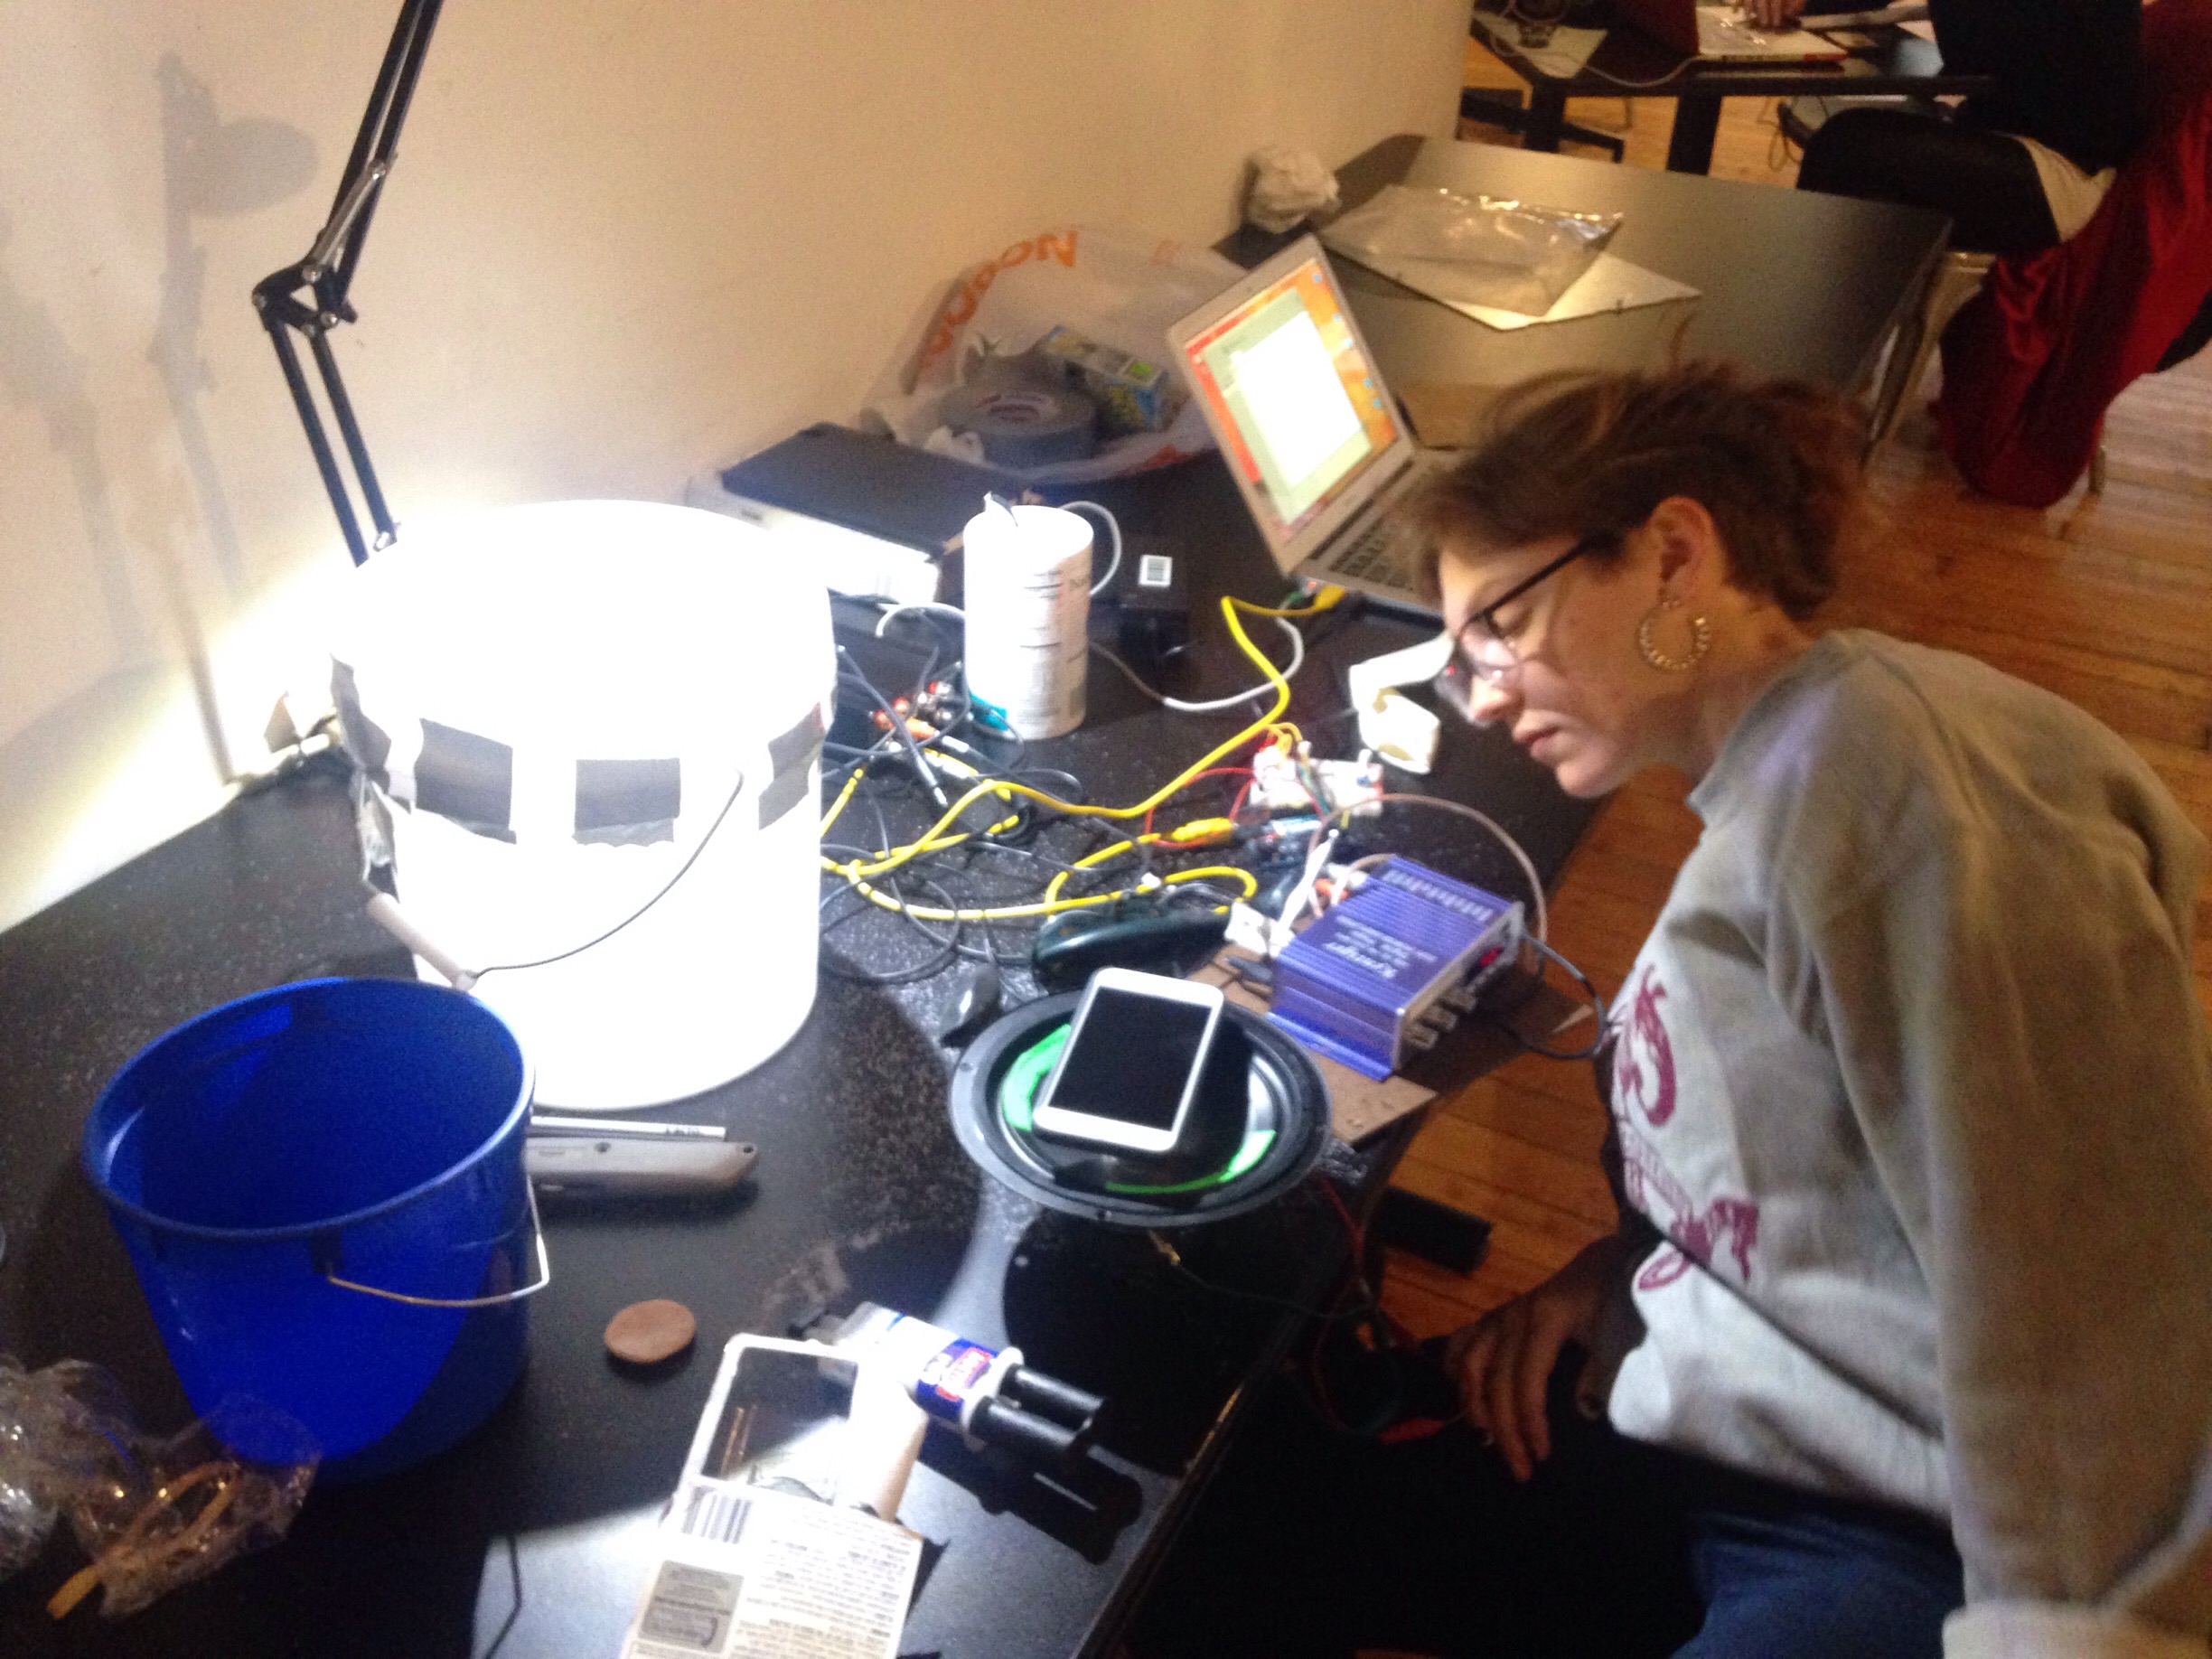
In our next iteration, we switched from FSRs playing specific tones to potentiometers that we mapped to amplitude (volume) and frequency. Next, we wired up a speaker a friend had found on the junk shelf but…it gave us a really weird signal. Part of the problem was that we didn’t know how to work the amplifier, because we realized when the amp wasn’t connected that we were getting our clear tones!
testing our speaker
So we nixed the amp for the moment and moved on to our latest set up, which consisted of a bucket with plastic wrap stretched across the surface. We tried two different size buckets, one with about a 5 inch diameter and the other with a 10″.
IMG_4588 from Zoe Bachman on Vimeo.
The 5″ was slightly too small for the speaker radius while the other was too large. Jed suggested that rather than affix the bucket directly to the speaker that we instead place a dowel in the vocal coil and drill a screw through the bottom of the bucket. This was great because we could experiment with the two different sized buckets .
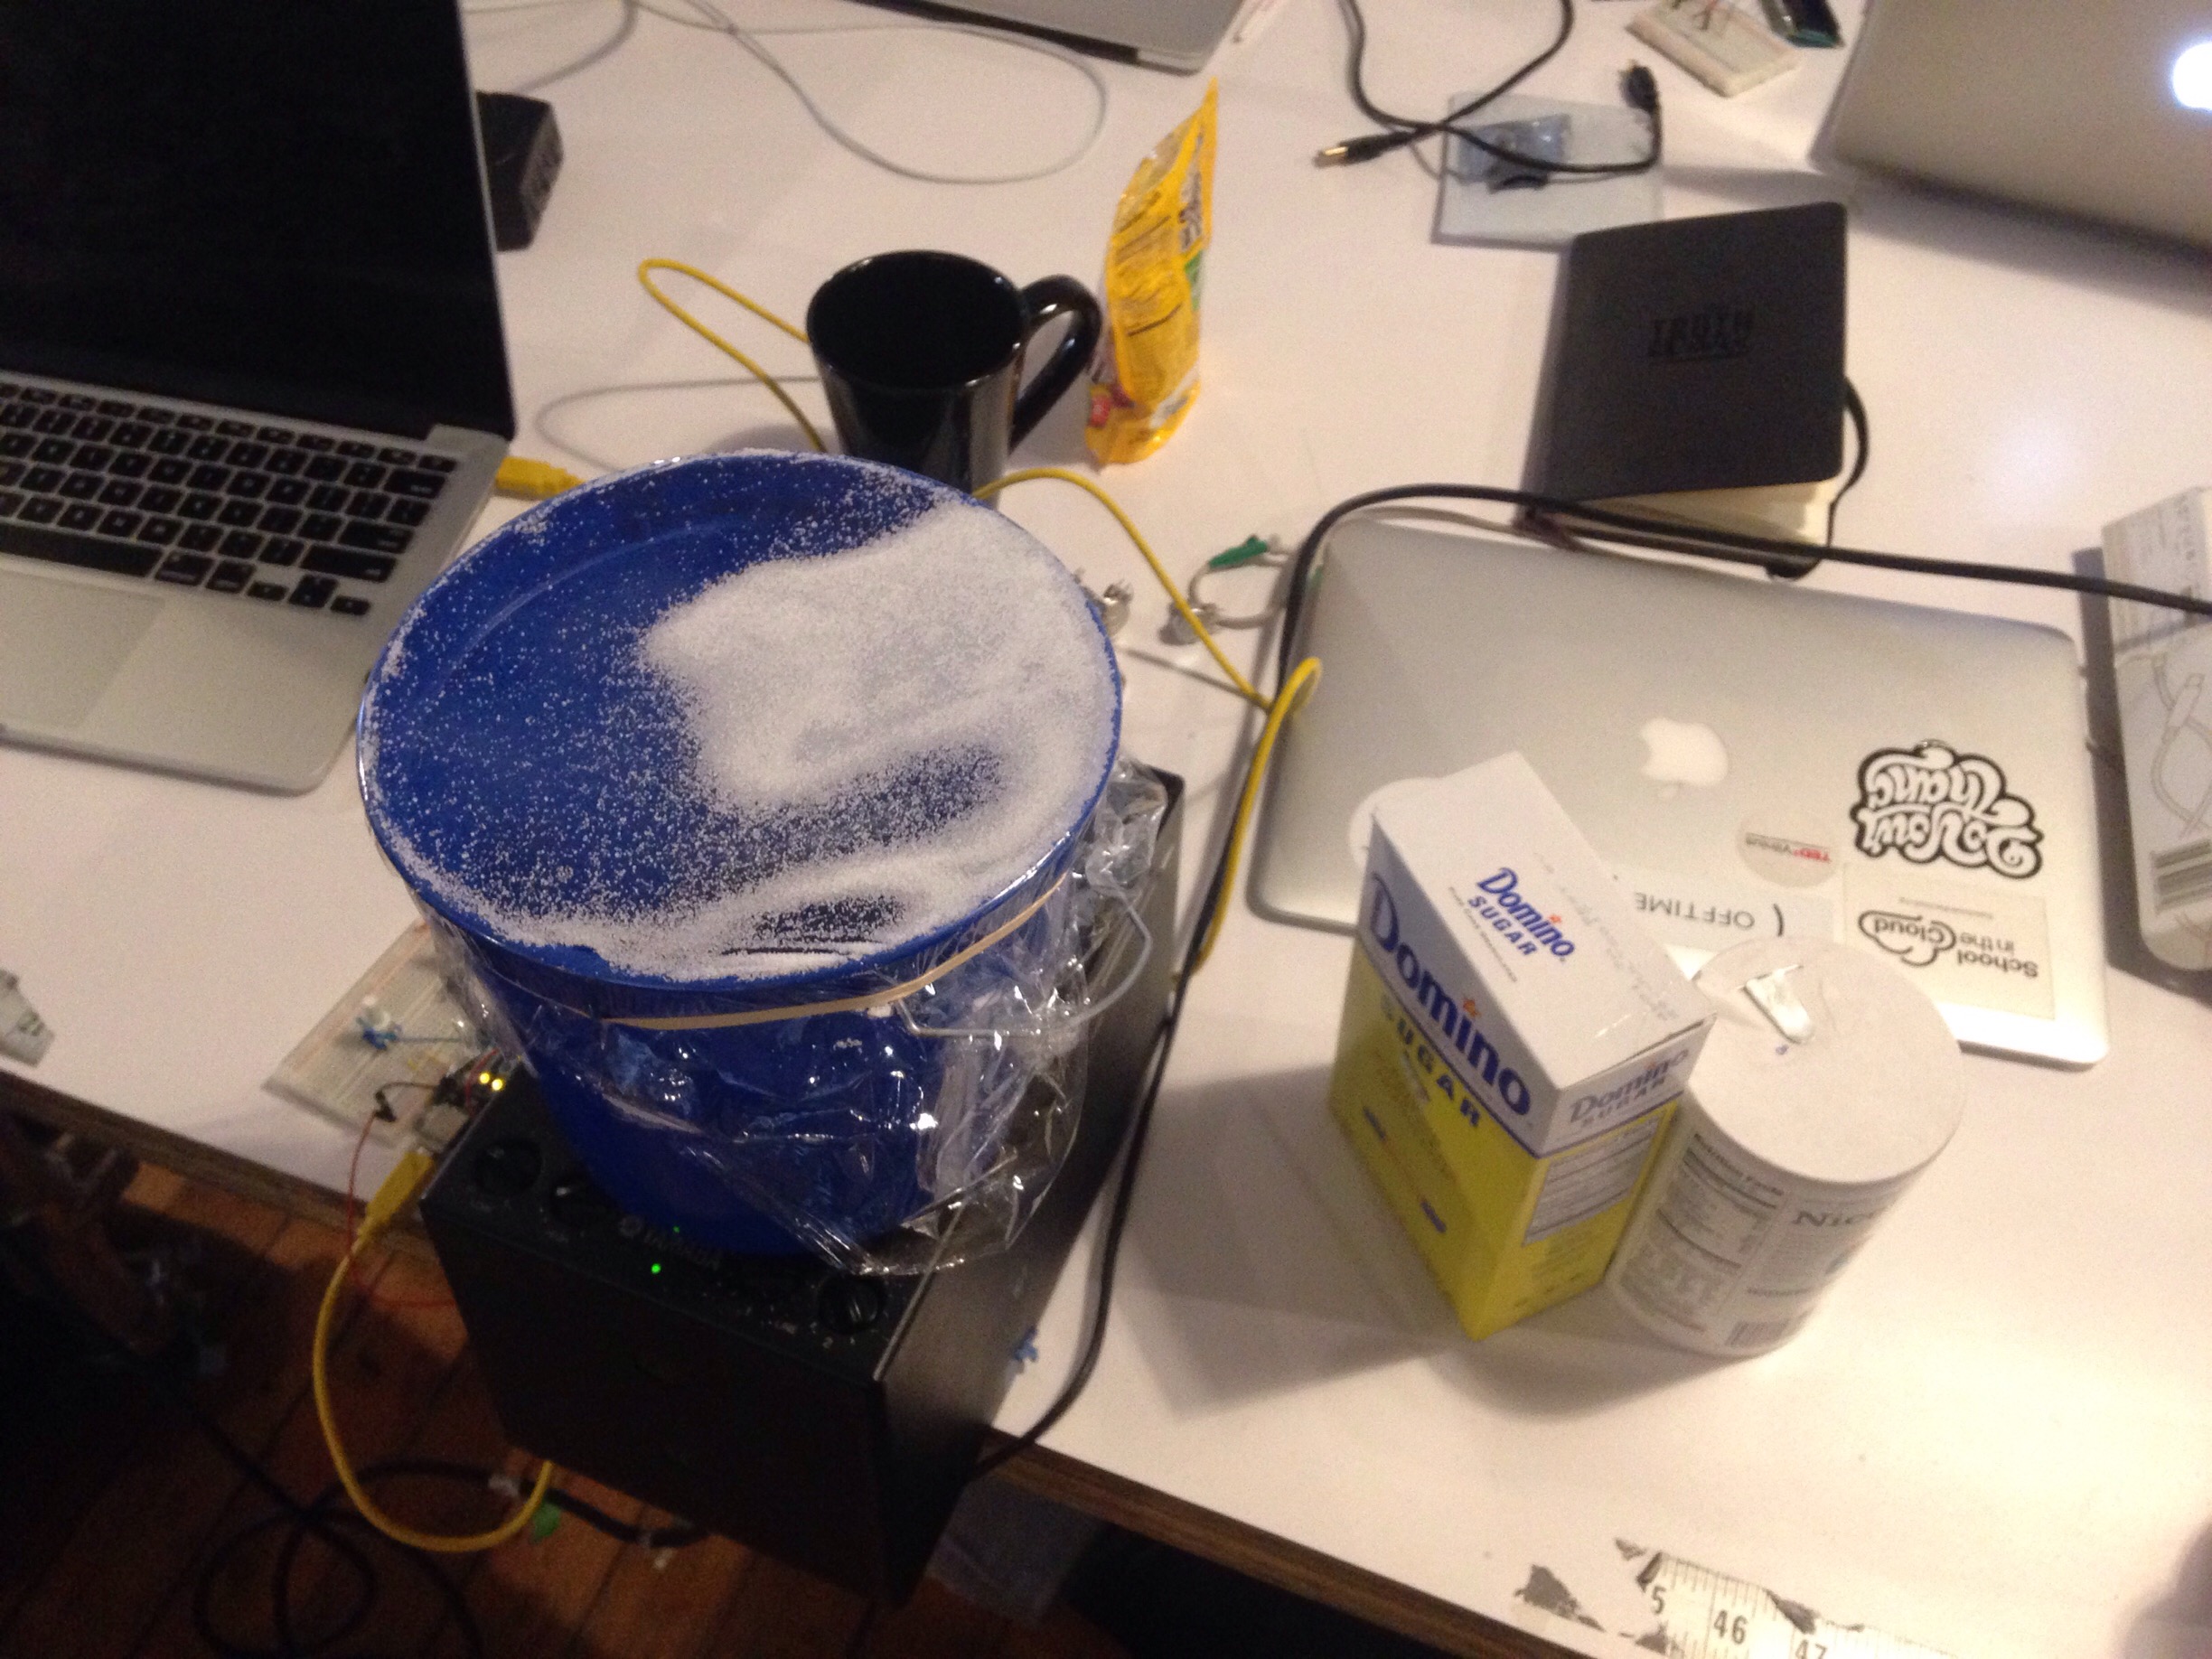
bucket with sugar and salt
checking for vibrations
We ran some mini experiments to figure out the best surface materials (plastic, latex) as well as different objects (salt, buckwheat, rice). While we were getting movement, we still weren’t seeing the patterns that we expected/wanted.
TK had mentioned acrylic/plexiglass as another possible surface option, so I picked some up while over on Canal Street. Good thing, because plexi ended up being the best possible surface! We tried out two different thicknesses, with the thicker one giving us the best result.

Eventually we were able to see at least six distinct patterns emerge as we altered the frequency and volume. Video forthcoming!
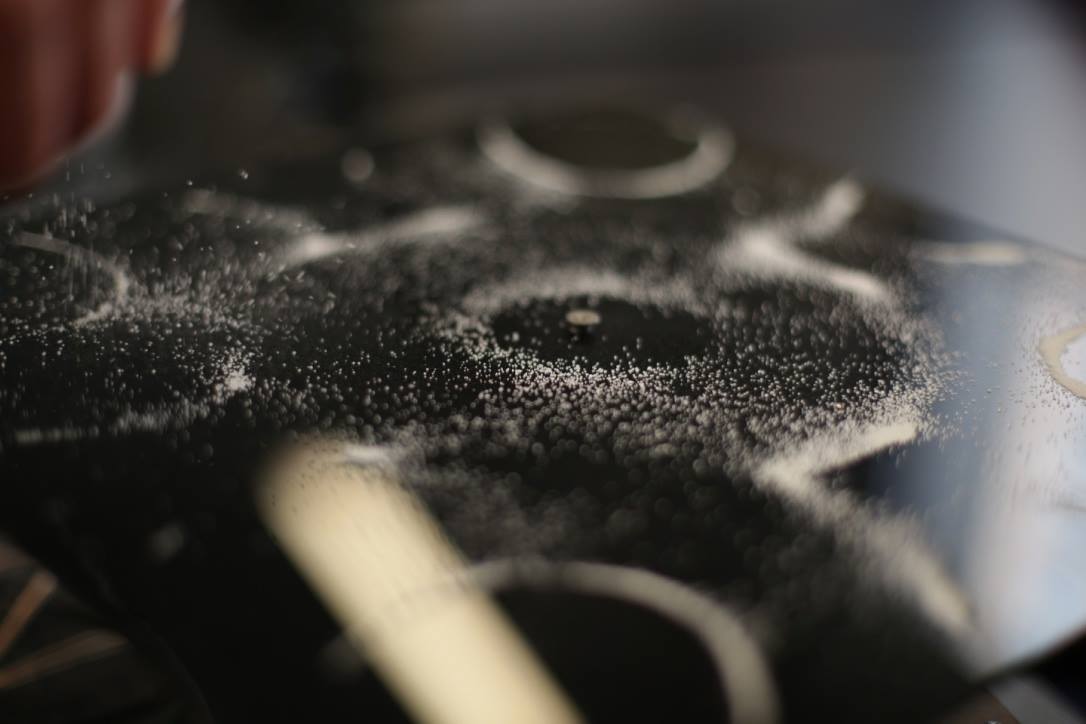
close up of one of the higher frequency patterns
IMG_4597 from Zoe Bachman on Vimeo.
ICM, Wk 8: Vid/Sound
This week, I wanted to continue visualizing these “ethereal” elements of technology.
I’ve been thinking a lot about how technology takes us out of the present, almost like it transports us into another realm. Using our phones, we’re in a sort of liminal space where our bodies are present but our minds are elsewhere…
Like I mentioned last week, it’s as if we’ve gone a step further from Marx’s object fetishism and alienation – now we even forget that we’re holding a physical object in our hand. How is our relationship with technology further distancing us from or creating an atmosphere of denial when it comes to thinking about the labor and the people it took to create this specific experience? The resources?
I went to the Radical Networks Conference this weekend and left feeling super inspired. A lot of people are playing with these questions of how do we visualize/materialize these unseen technological forces – from wifi and bandwidth, to cloud computing. One thing I DIDN’T get to, which I wish I had was Shuli Hallak’s talk on “Seeing the Internet.” From the program description:
“The power of the Internet is derived from its intangible, invisible properties. The ability of information to scale and traverse in an instant is transformative, and the application of that power can be used in multiple ways, some good and some not so good. Because we can not see these systems that we rely on — the hardware (routers, switches, data centers, fiber cables), and invisible properties (spectrum, wireless networks, protocol) — we are as a whole, left in the dark and unaware of how our own data exists in these networks. We often take a breath and hope the entities that we are “agreeing” with (“trusting”) will do good. And we are presented with less than desirable options: convenience or privacy, but we can’t have both. Really though, if we can’t see it, we can’t fully trust it.”
When I was an undergraduate (as well in my professional practice), I was always interested in the concept and systems of power. I think there is a lot of mystique that imbues the internet and other recent technologies with an aura of power (re: Walter Benjamin, yo). Humans have often assigned mystical powers to those things they don’t fully understand, and how many times at ITP have we talked about it being a “magical” place?
Now, it’s not like I’m trying to totally erase that sense of wonderment, but I do think we need to be more critical and informed about these systems because in reality, they are built and sustained by other humans – and as can be seen in this piece, often those without access to power and really don’t derive any power (political, economical and otherwise) from their participation in this labor system, i.e. making the internet.
——————————-
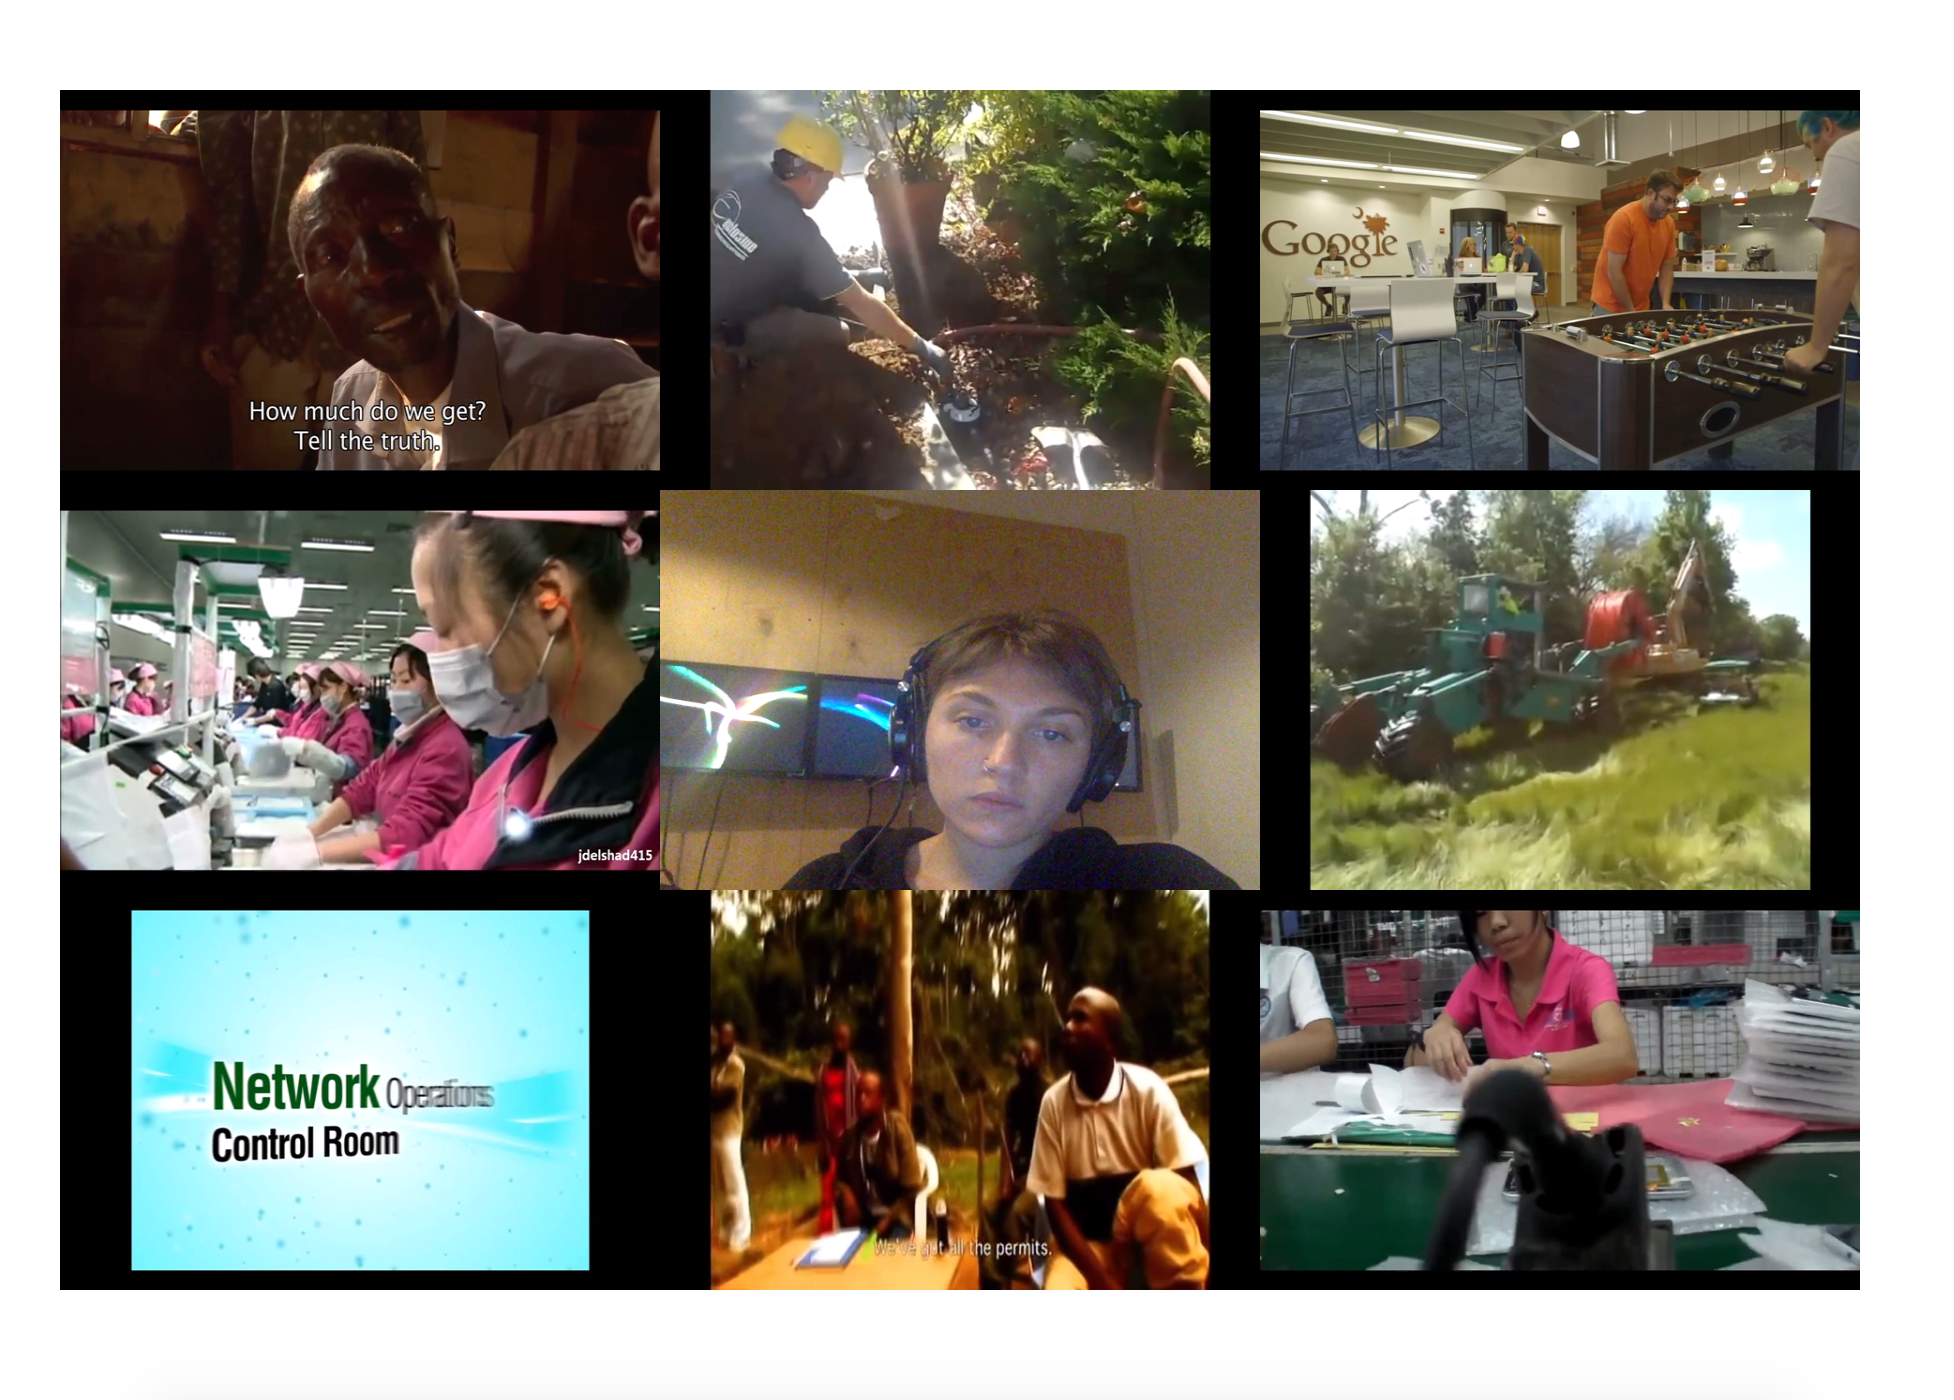
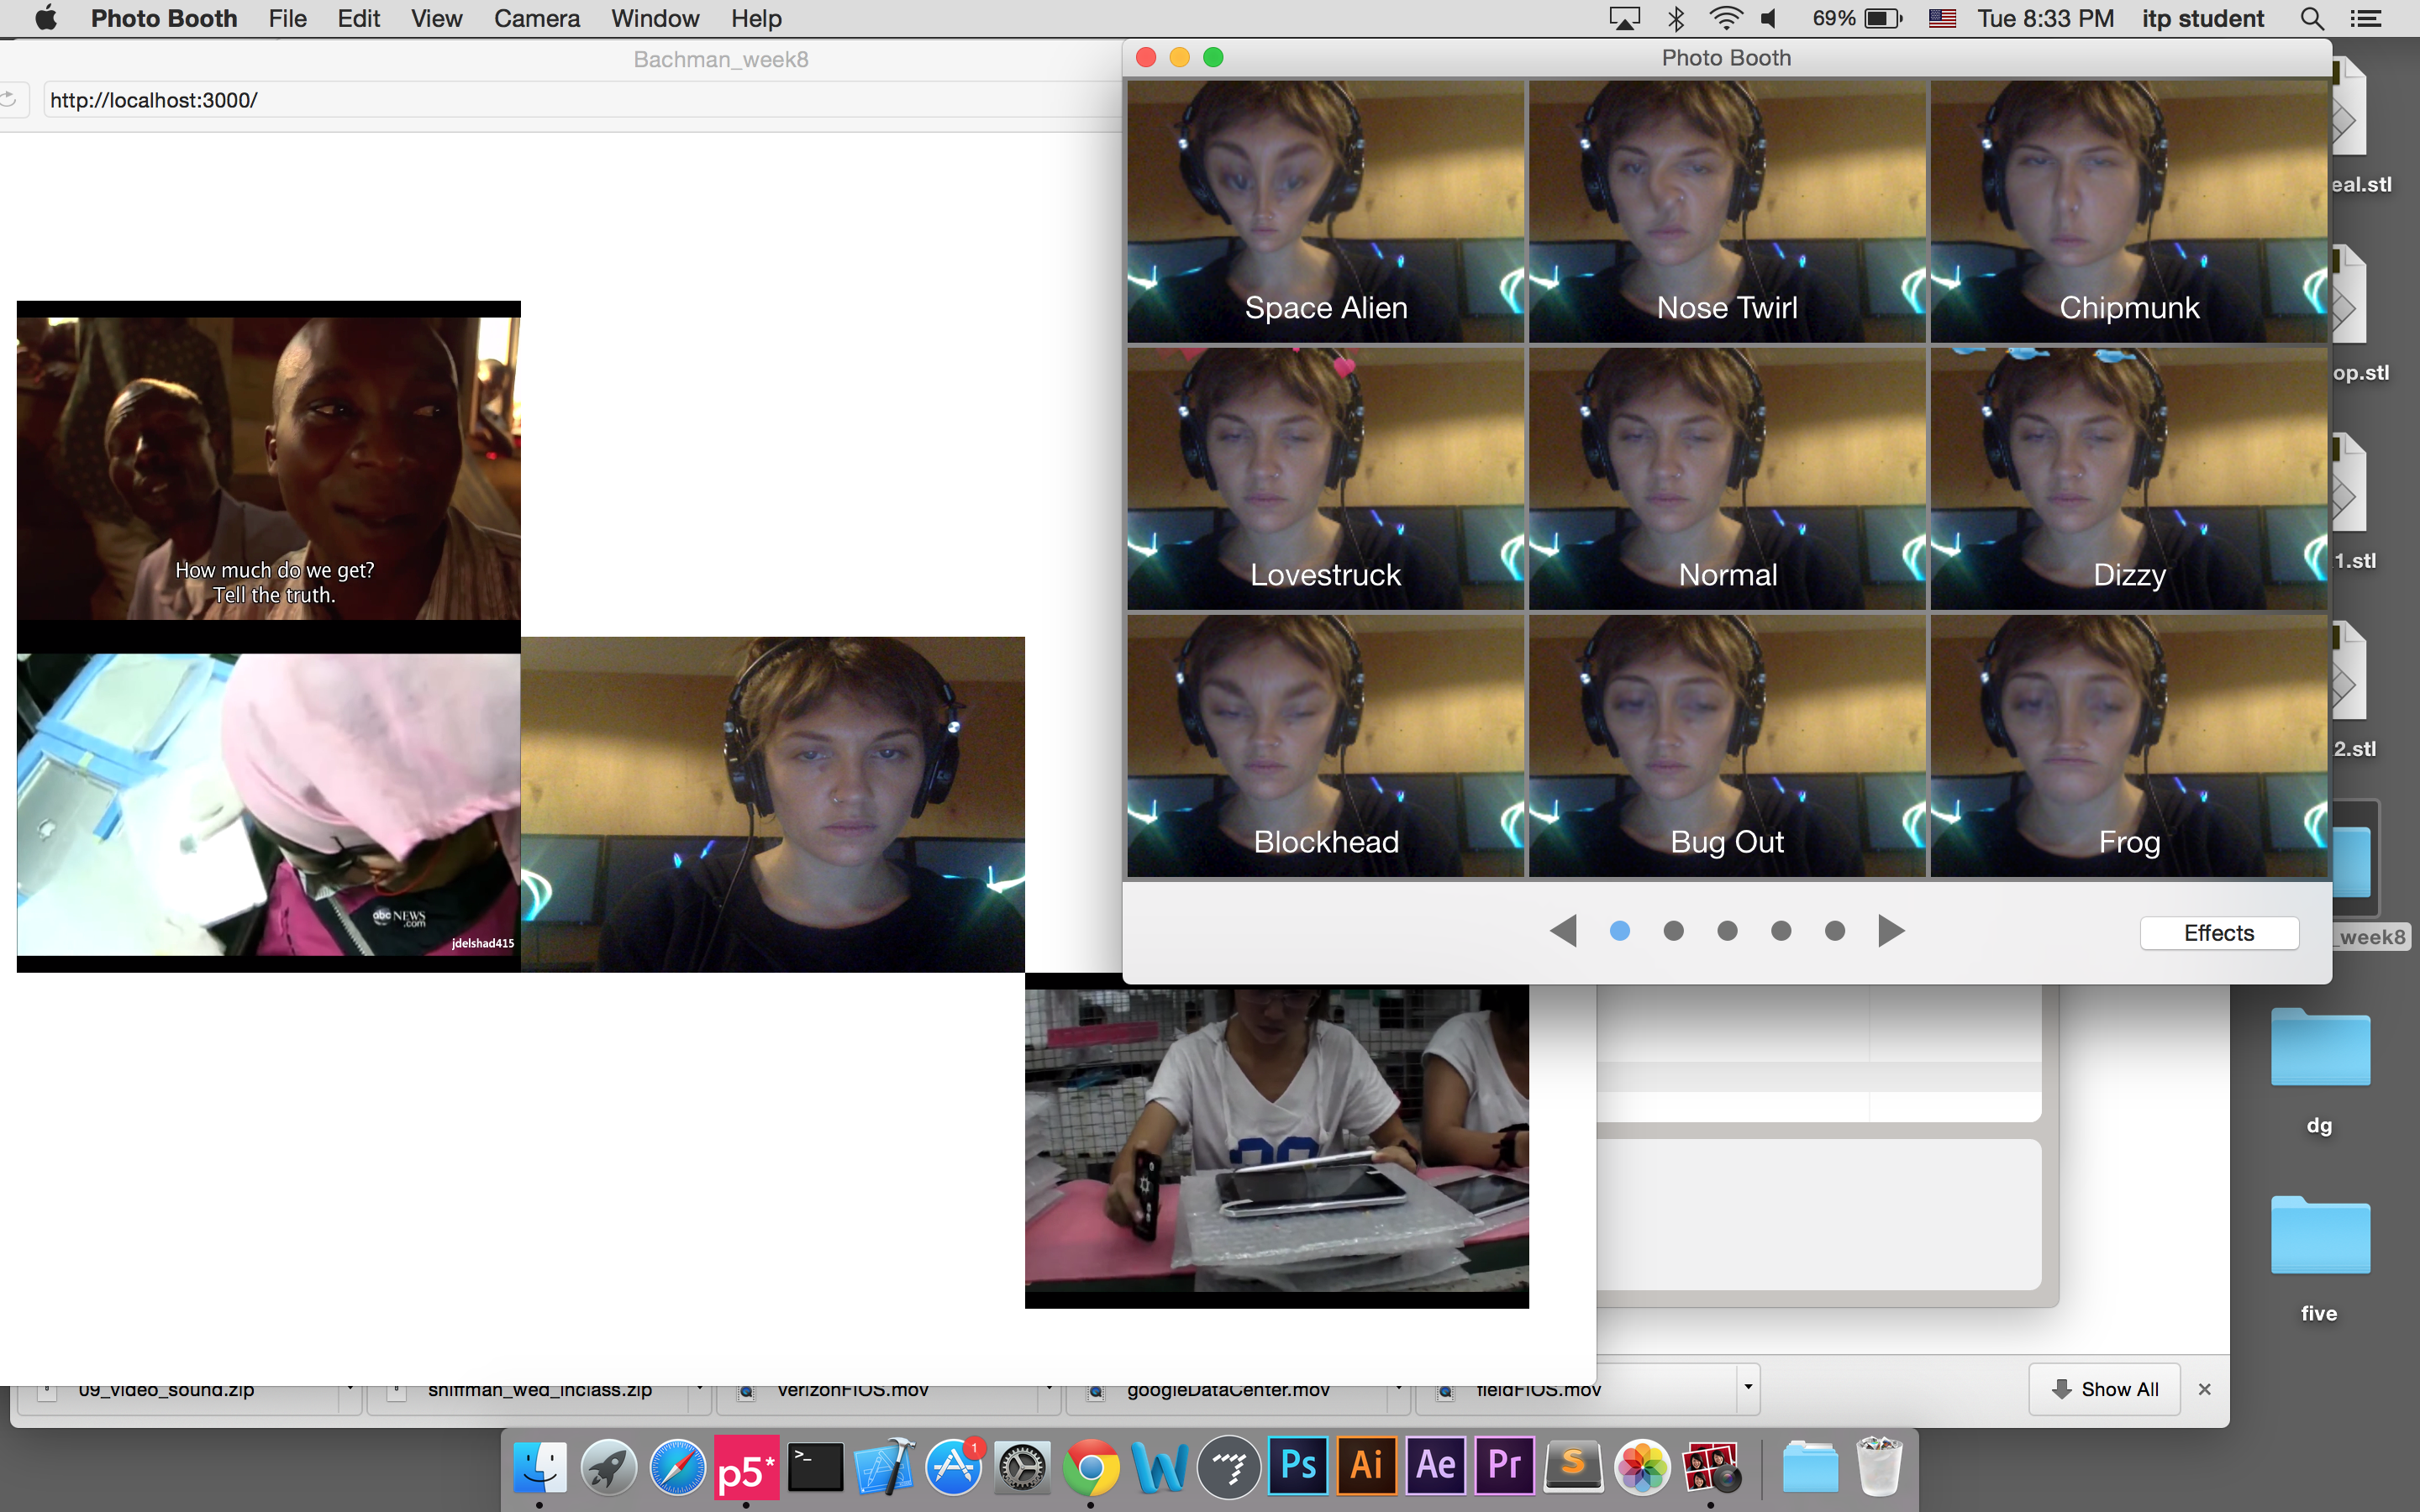
Last week, Dana suggested including people’s faces in my data center sketch to further illustrate the presence of the human element. So with that in mind, I thought this week I’d run with that as a concept. My idea was to feature a “brady bunch” -esque composition of the cast of people who help bring you the internet: miners from the Congo, Foxconn workers in China who assemble devices, construction workers who lay fiber optic cables, people in data centers, etc. Then, in the center would be…the user.
My intention with this sketch as that we get a glimpse at the people who are behind bringing us the internet and think about what our (moral? ethical?) relationship is to them and that while we may feel detached from the physical world while we engage with our phones, there are real political and economical forces at play.
One interesting thing I realized as I was putting it all together (and have casually realized) is how uncomfortable many people feel when they see themselves on screen. Often, they want to look anywhere else but their own face. This unease works to the benefit of the sketch, where the point is to look at the faces of others and consider them in relation to yourself.
Also – I found the secretive nature of these locations, jobs and forms of labor to be really interesting. It was more difficult than I expected it would be to find usable videos. Documentarians not allowed to film at mines, journalists getting “exclusives” from Foxconn, and even the videos of people laying fiber optics obscures the faces or don’t show them at all. Sometimes, in the case of data centers, they just don’t seem interested in the human component, rather the power of the machinery.
——————
My biggest issue in putting the sketch together was editing and compressing the videos. Originally, I wanted them to each play for a longer time – but I realized that would have made for huge files that probably would take forever to load. Even after editing and re-sizing, the sketch is still super slow to load. I think I’ll have to play with video export settings some more.
I realized as I was playing with the idea that the structure mimics the iOS Photobooth App…which, I liked as an additional visual metaphor.
(It did make me think that I could do a further iteration where the people are removed and replaced with a static background image representative of the different physical locations and then use createCapture() to overlay an image of the user in these places.)
ICM, Wk 7: Data
So, I’ve been eager to play with data. But I’ll be honest, I didn’t imagine the magnitude to how difficult it is to find/work with certain sets of data.
I guess this got me thinking about the nature of “Big Data” and how we understand this information as massive quantities, yet at the same time just see this information as existing in some kind of nethersphere out there on the internet.
I’d read something in The New Inquiry that made mention of how we forget that data centers are actually these physical entities, dealing with “real world” issues like electricity, water, borders, politics, etc. I thought it was funny that we think about our data stored in these “clouds”, but never associate that same data with a physical reality, in a building in Goose Creek, South Carolina. It also prevents us from thinking about the cost of these facilities, particularly in terms of the amount of natural resources they use to power and keep them cool (More on that, here and here). Just recently found out that the NSA was Baltimore Gas and Electric’s biggest customer. (Having paid my own share of BGE bills, can’t imagine what theirs looked like…)

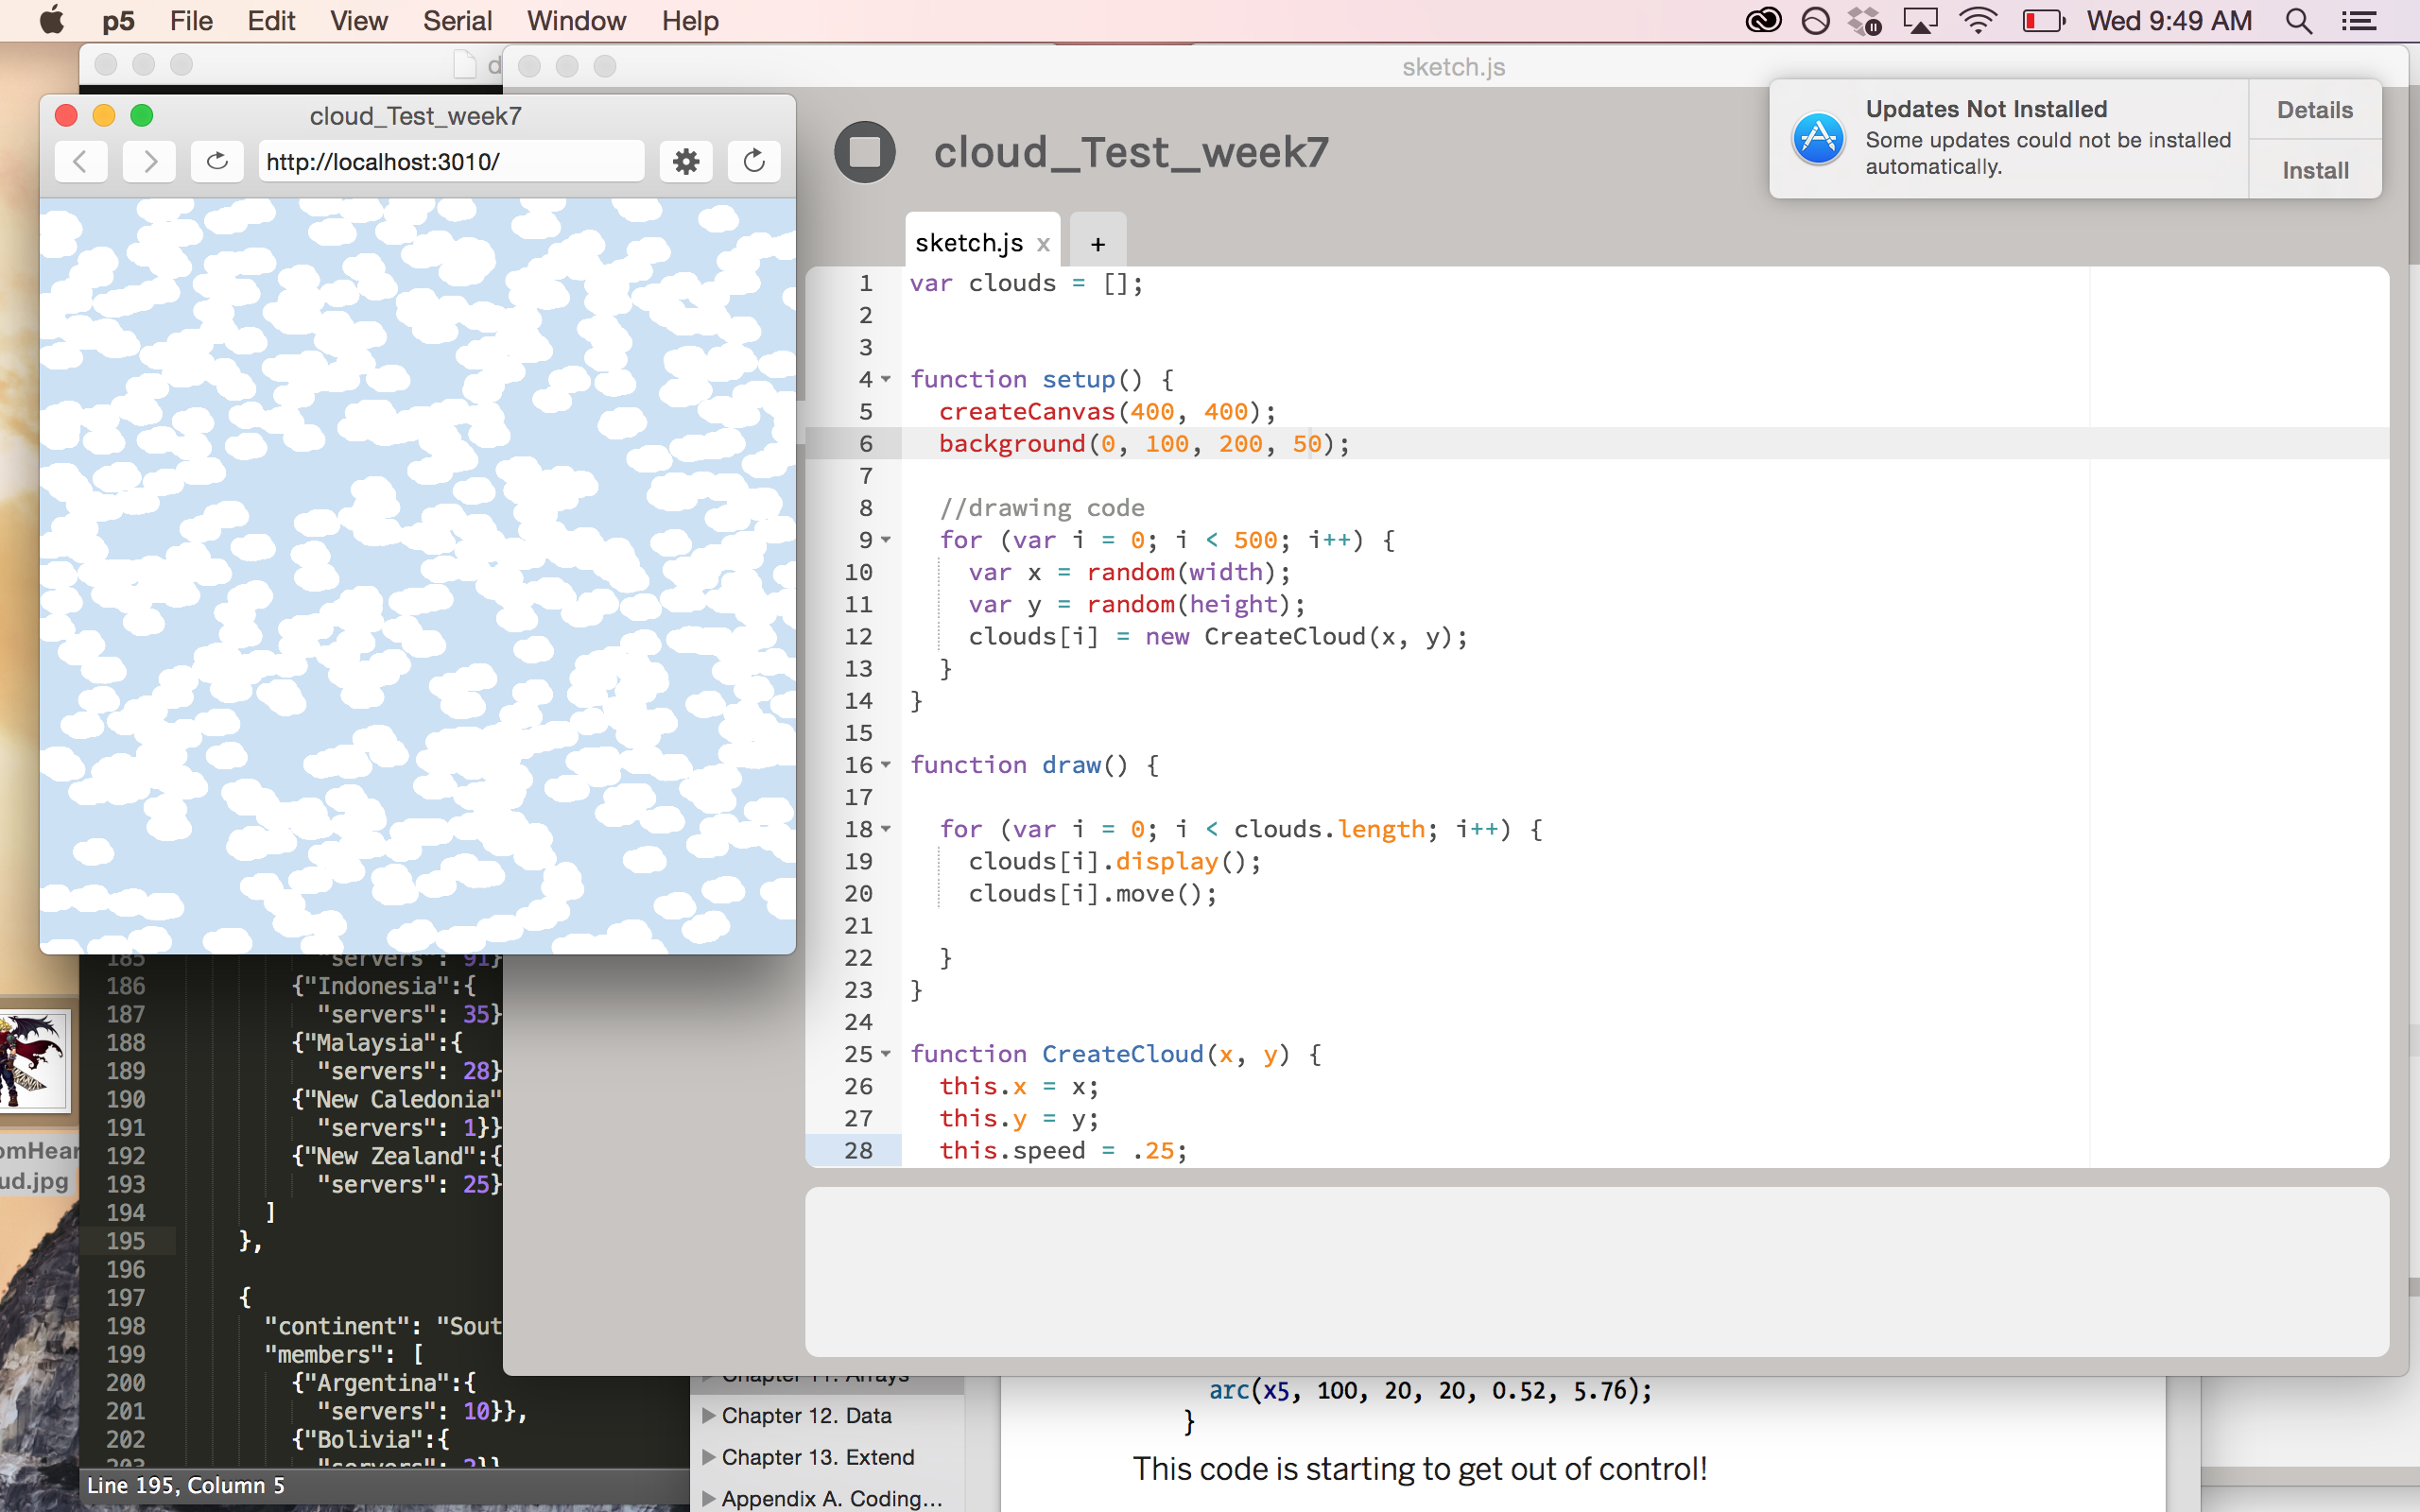
I found a list of the number of data centers in each country (link) and decided to try and make a JSON out of it.
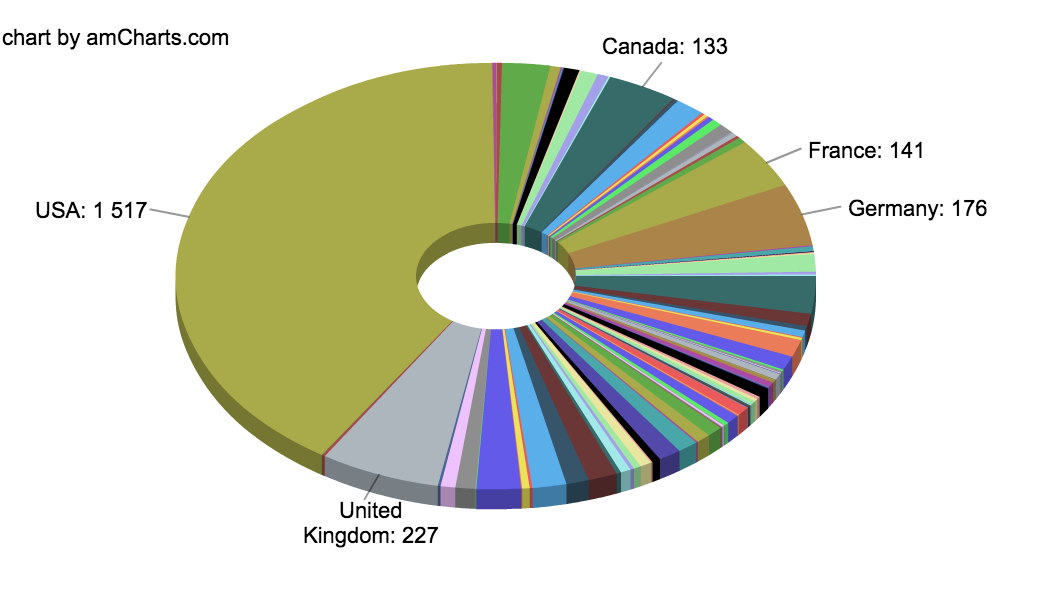
A person could enter a country and then the number of servers would pop up, and (eventually) a cloud representing each data server.
Easy, right?
I figured I’d look at the bird one and use that.
I switched the category names to suit my data set, which was easy enough. The trouble was that I wasn’t sure how to assign the number of data centers/servers to each country within the json syntax. After looking at a few examples I asked for help and found out I was doing my object notation wrong. So re-wrote that. (I don’t think this paragraph does justice to the amount of time it took writing/formatting the json file sooo….I’ll just leave that there.)
Once everything looked good it FINALLY loaded and I got
the letter i.
a single i.
It was supposed to be Angola.
So I played around with the code that called the json in my sketch, tried it a different way and got undefined. So at least the data is there.
I looked at some code examples in Getting Started With p5.js but at first wasn’t sure how to modify it in the correct way. Tried a couple different things to suit my json, realized I needed to add an extra array…and YEAH! I GOT IT TO SAY MOROCCO!
But what I reaaaaally want is for it to give me the number of data centers. I guess. ugh. small victories. bigger struggles.
This was another struggle.
Thought maybe I needed an extra array, so that it would read var server = members[3].country[0]; but it didn’t like that either….Then I substituted it for a specific country name and THAT worked. Still not sure how to isolate just the number 4 though and (still) not sure if that’s going to affect how the rest of sketch works.
At this point, I’d been just printing this information to the consol so I opened it up in the sketch – but WEIRDLY when I tried to get that data in my sketch, I just got [object object].
At this point I decided to take a break from the data stuff and move on to getting some of the other elements of the sketch. Thanks to Ruta, I got my button in my sketch. But it doesn’t search anything…my getServer code didn’t seem to like me. I added variables but…it didn’t seem to like it.

I also was able to make a sketch that mocks up what the screen would look like if it got the right data. Basically one cloud would be drawn for every server in that country.
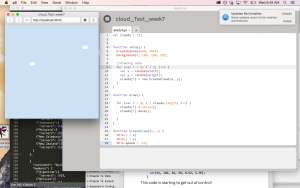
But yeah, calling the json to make it do that is still not working. So here’s the code I’ve left off with:
One thing I want to play with is creating separate query versus display functions, because right now I think both of those are happening in the same place and I’m not sure if that’s messing things up.
I’ve also realized I’m just generally confused about how to call json files. I’ve tried looking at a couple of examples an modifying them to suit this sketch, but just not getting anything to happen with button. Perhaps it’s my DOM code as well? Or the way I’ve organized my json? I was really confused as to if I should make my “servers” an array (I tried it with some of them).
Oh yeah, here’s the json I made (in the sketch I was playing with, I tried turning just the African countries into arrays for the purpose of testing, doesn’t show in this):
PComp, Wk 6: Application
I couldn’t find a sketch from ICM that I liked that I felt like I could use with an analog input.
Instead, I looked at the mapping code and modified it so that instead of drawing a graph, I’d draw circles that would grow in size the harder I pressed down on an FSR.
I mapped the sensor data to the circle’s diameter.
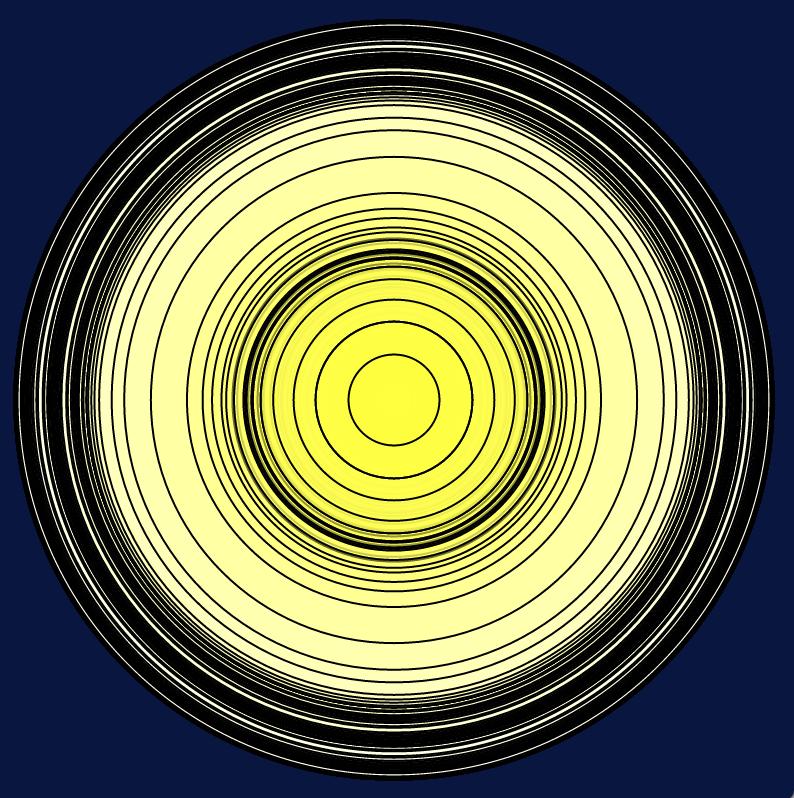

I also played around with mapping it the circle’s fill – first substituting it for one of the colors, then also using it to modify the opacity. I played around with which arguments it modified and also tried it without a stroke.
pcomp_application1 from Zoe Bachman on Vimeo.
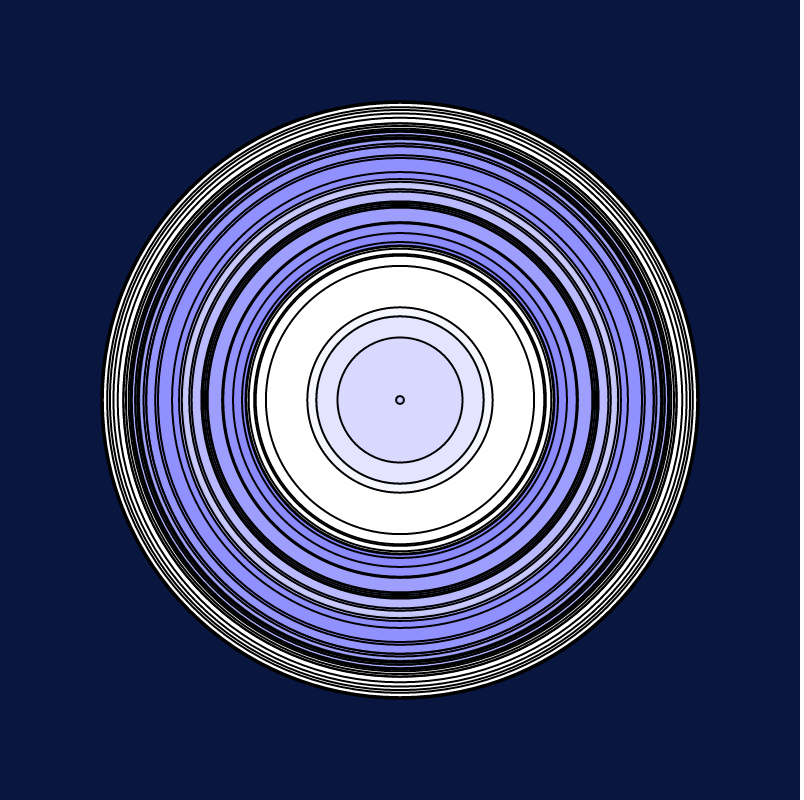
Then I thought, could I modify the color and the size separately, using 2 FSRs? So I looked at the code for the lab that used multiple sensors and adapted that for my two FSRs.
One version of my code:
making use of that punctuation…. Checked their readings in the serial monitor and everything looked good, So I went to go mess around in p5. That’s where I ran into some difficulty. The code for the size and color of my circle was within the same function…and how do I distinguish between new data coming from FSR1 and that coming from FSR2? So, looked at this lab where it looks like there are promises of using multiple sensor data in p5… Oh. That’s when I noticed that this lab is doing ALMOST EXACTLY WHAT I WAS TRYING TO DO. Except with an accelerometer instead of FSRs. I mean, I knew drawing a circle wasn’t original, but… Well. Too late. Continuing on… I followed the lab, and instead of doing location and color the way they had it, I used my size and color code. But it was super helpful to see how they used the array notation to split the sensor reading.I uploaded the sketch for 2FSRs but when I got to p5, the circle would change size but there was no color. And then, I’m not sure what I did. But I guess I changed something in my code because I got it to work! Mostly messing with commenting things in and out.
I also realized that it was mapped in an inefficient way, so I switched those values and I got back to the “animation” I had before. I also placed the background back in setup() so I could get that concentric circle effect I had previously.
Then I thought, I’m really only getting shades…but I wonder if I use two variables (diam and col) in the fill arguments if I can get different colors…
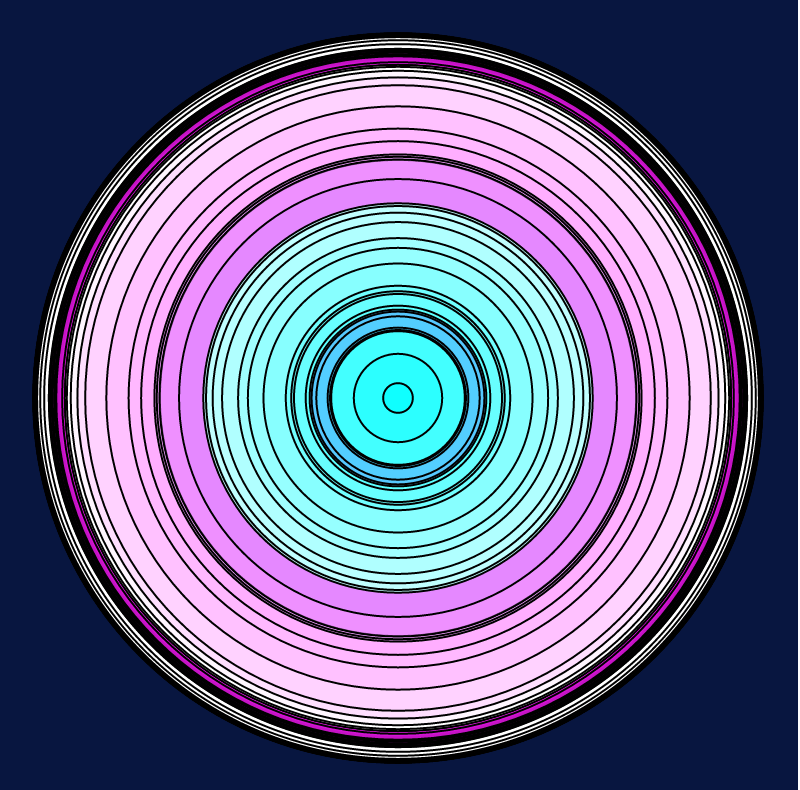
Reminds me of those giant jawbreakers I had as a kid!
pcomp_wk6_vid2 from Zoe Bachman on Vimeo.
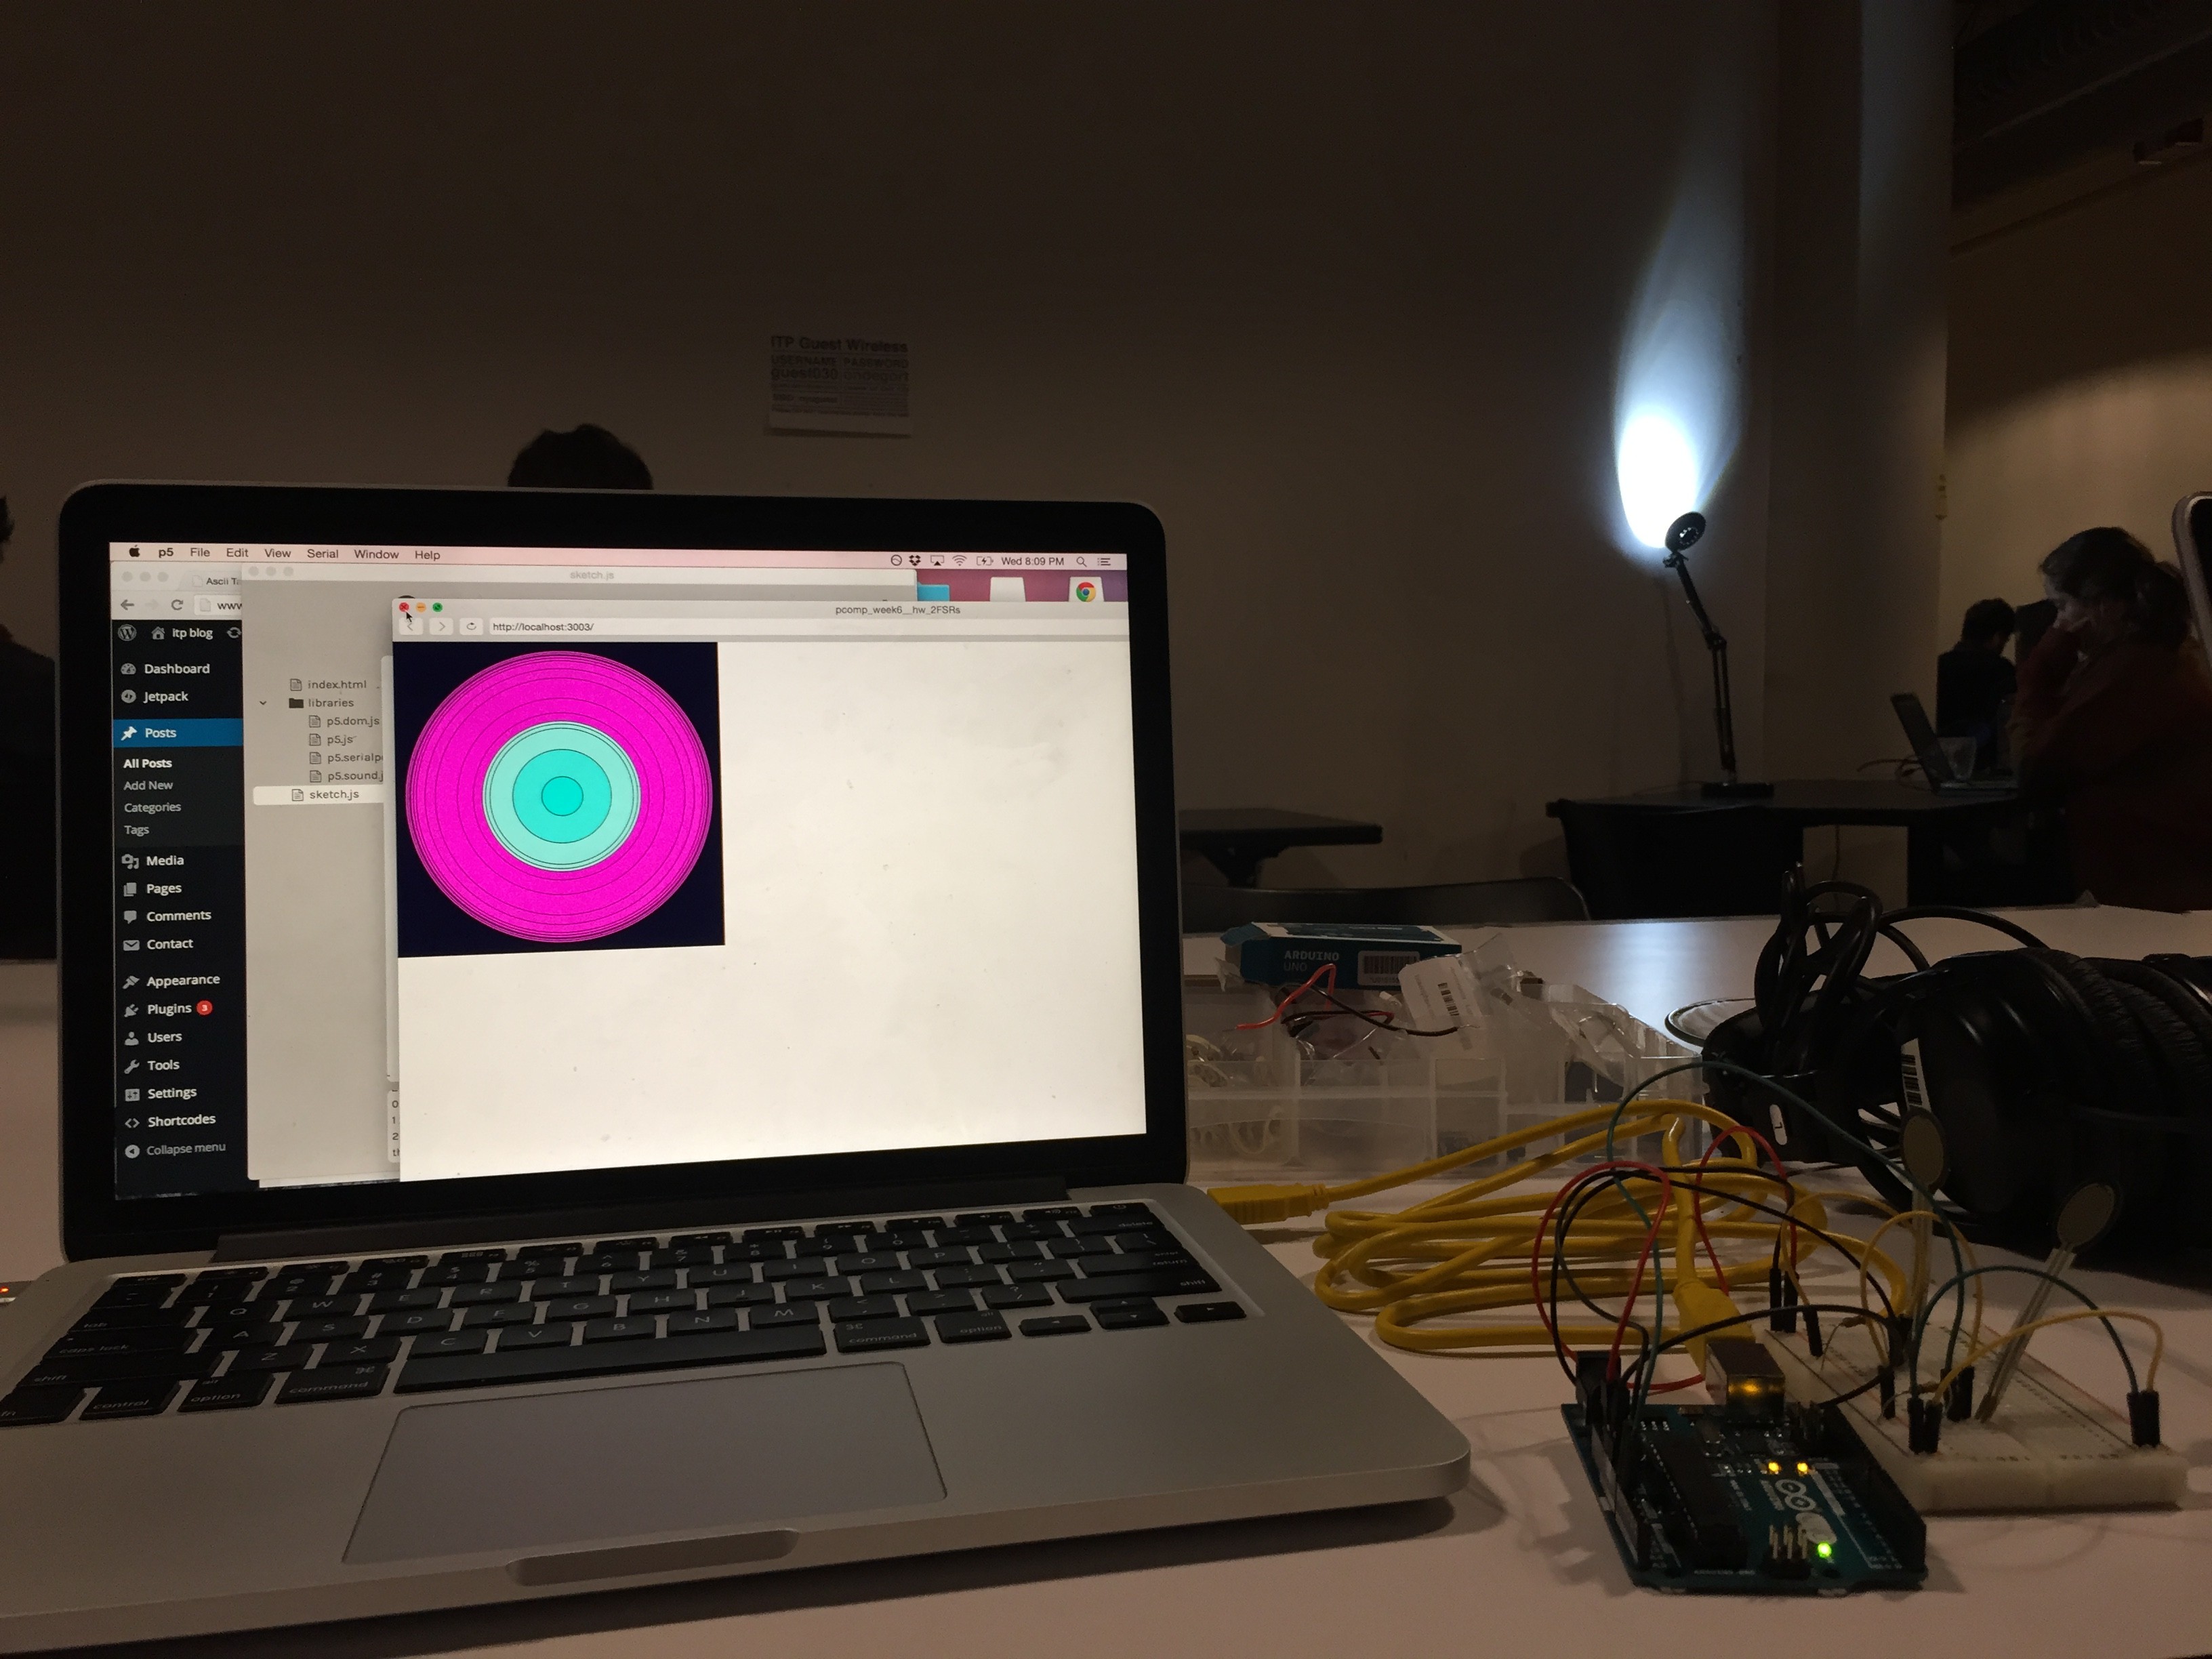
Or, better yet…

PComp, Wk 6: Serial Input Labs
One thing I really appreciated about doing these labs was how they illuminated small bits of code that we’ve been using since the beginning, but honestly I had no idea what exactly it all meant (re: 9600 bauds, especially). Now I feel (slightly) more confident with writing code, or at least with dealing with the serial monitor.
Lab: Intro to Asynchronous Serial Communication
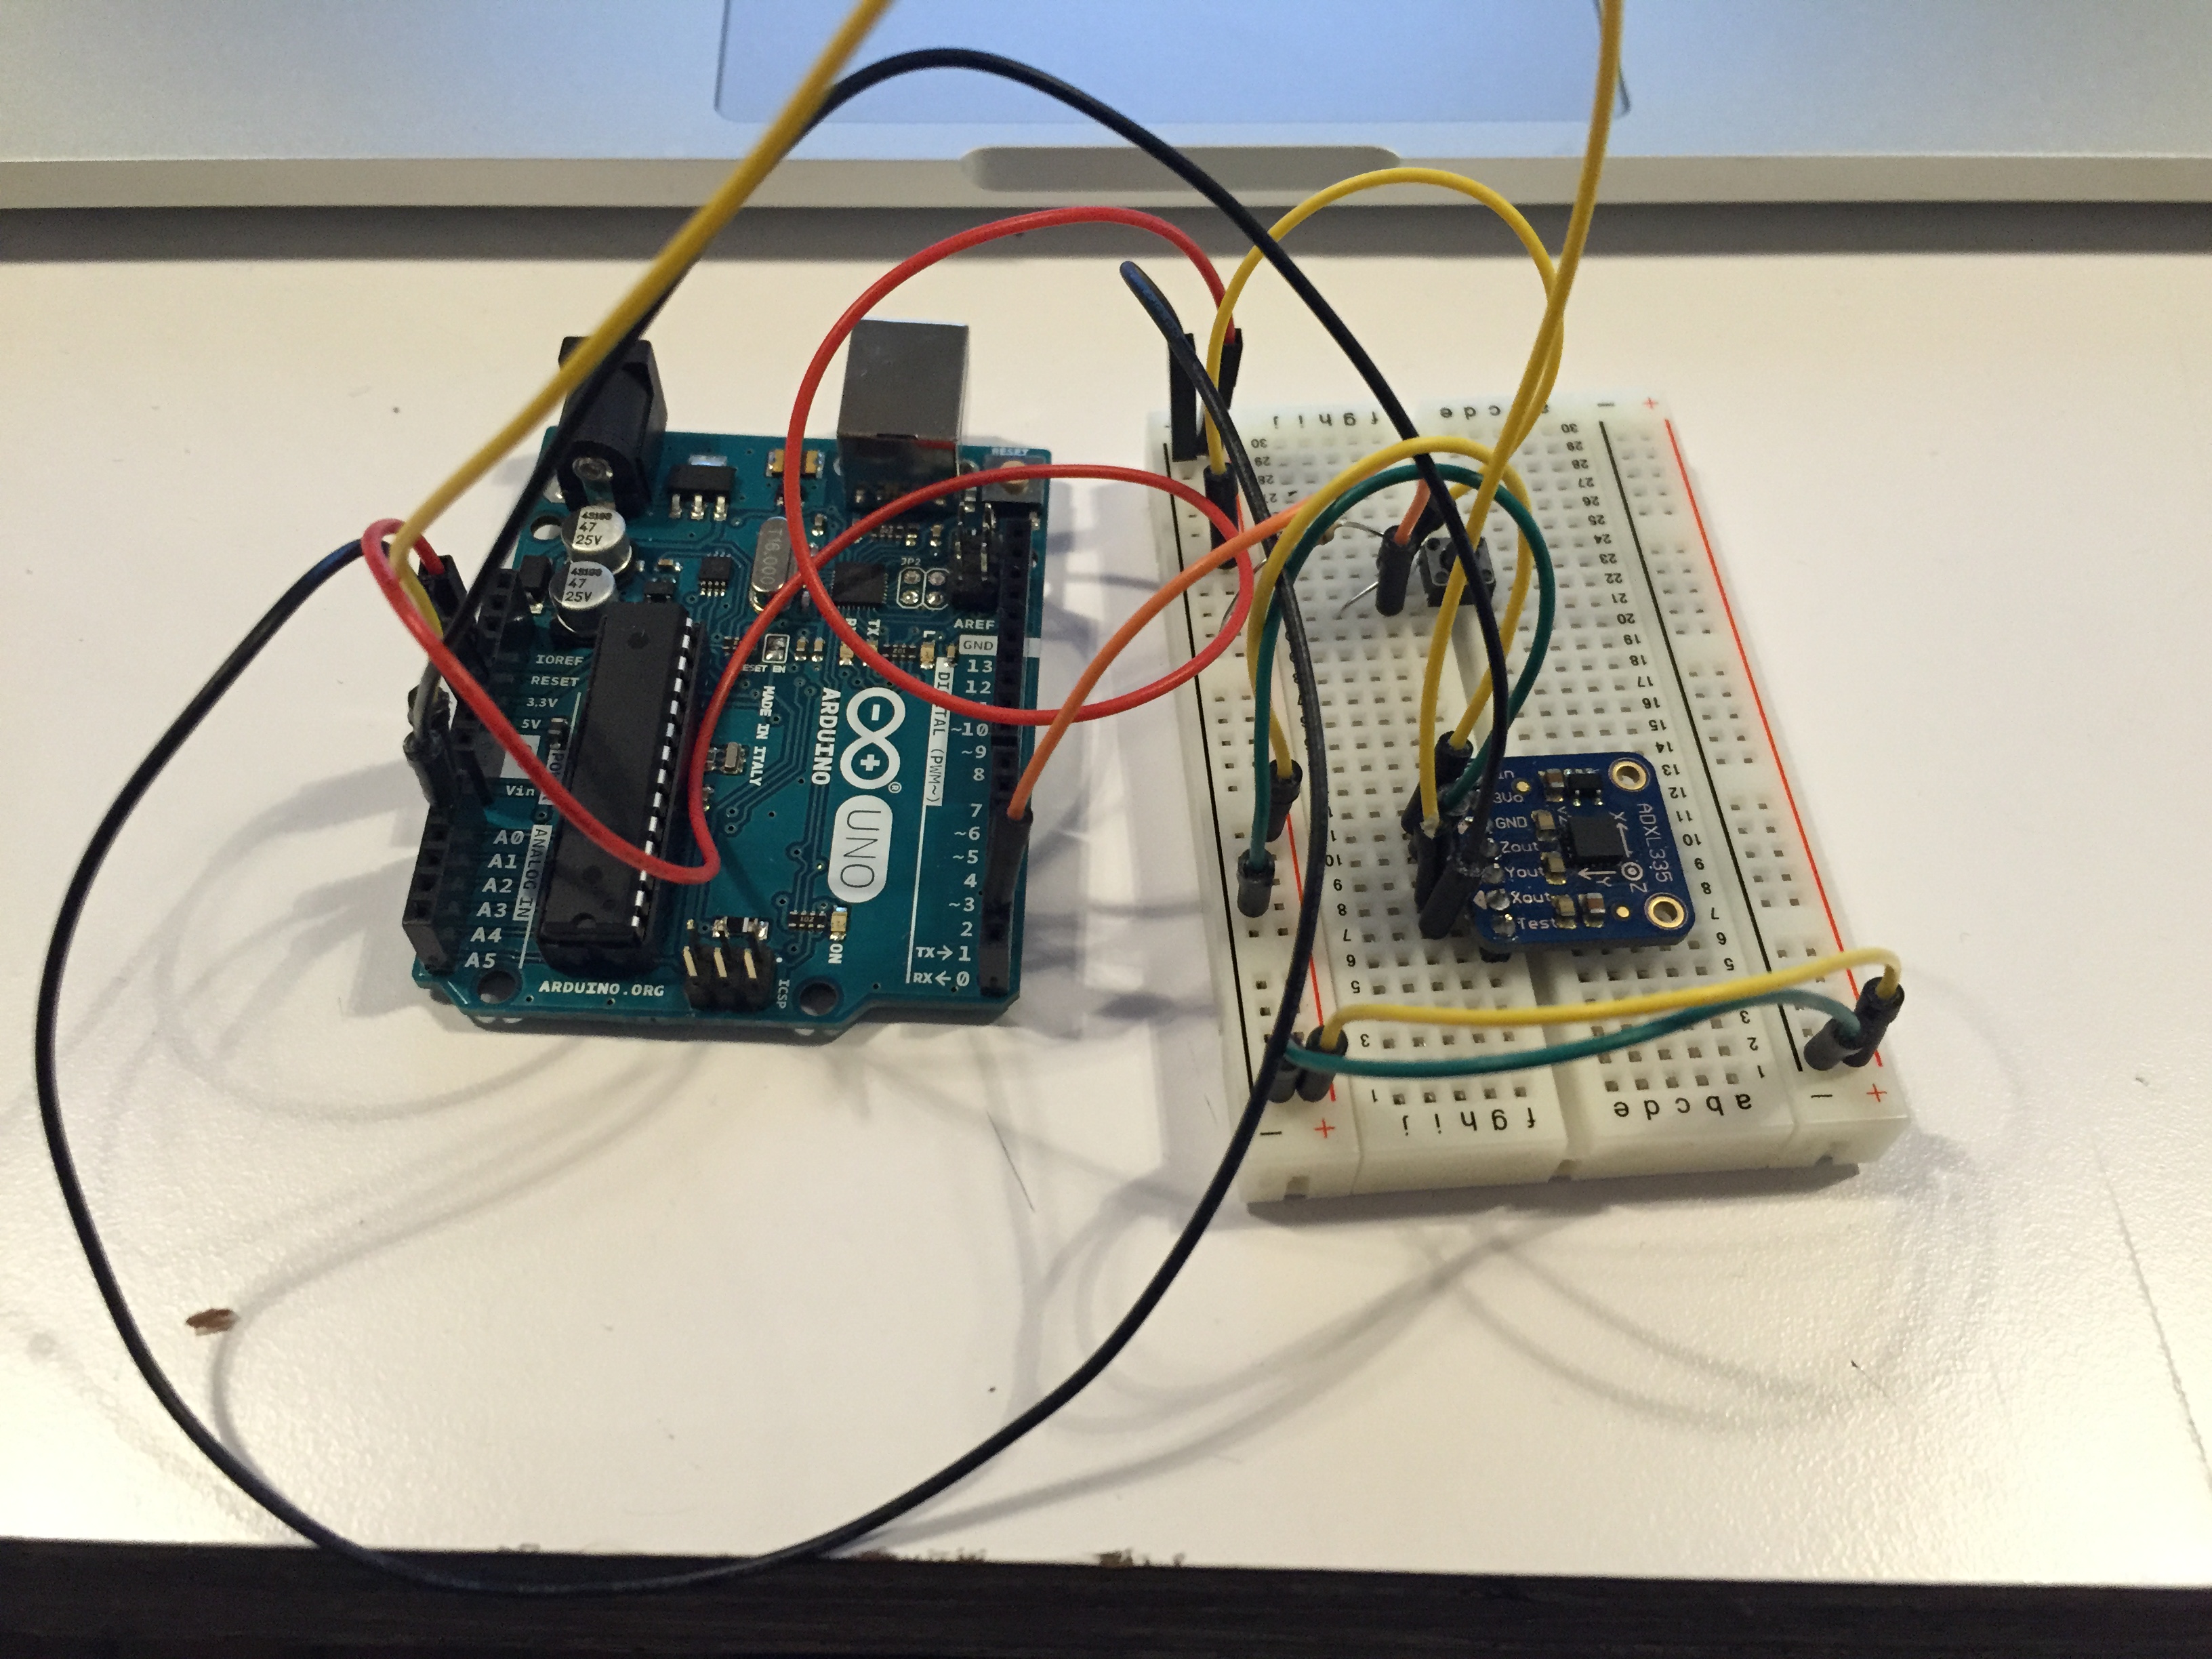
First thought: “Oooo I get to try out an accelerometer!”
No problems with hooking up the circuit. Starting to finally feel like I’ve got a hang on (some of) this stuff.
Now I also get why we didn’t do serialWrite like we did digital or analogWrite for output – get garbage numbers! sends out binary that we can’t interpret.
Alright! Got serial monitor results for all three sensors, and I can distinguish them using punctuation. Cool. Also got the call and response way to work. Feeling good.
Moving on to the second lab…
Lab: Serial Input to the p5.js IDE
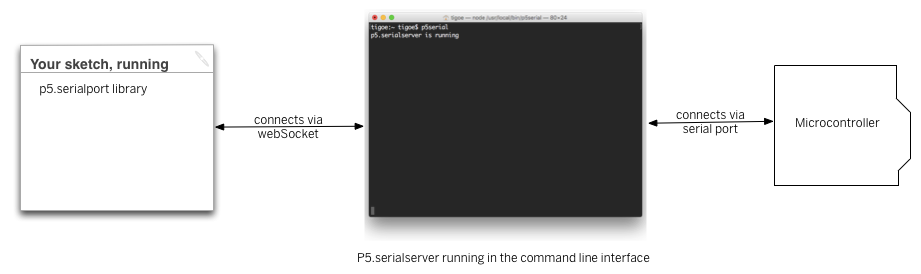
This statement confused me, not sure if it’s a language or concept thing: “The P5.js serialport library can’t access your serial ports directly when a sketch is running in a browser or in the P5 sketch window.”
So, I thought the serialport could communicate when the p5 sketch window was open? Reading further…oh, communicates with server on computer. So it’s just not a “direct” connection? So the sketch isn’t connected to the device, but the code controlling the sketch/IDE is. I think that’s what this drawing means:
When I did my p5 sketch…only got one port? did my USB need to be plugged in? Plug it in…and still only one:
ws://localhost:8081 – which, doesn’t look right to me.
So hopefully that’s mine? copy and pasted the code instead of typing and the same thing happened. So, guess that’s how it goes.
Well, when I started doing the second part of the lab – I got ther error and its also now listening 3 ports, including a USB that must be mine. I switched it and it worked! Or at least, there were no more errors. Not entirely sure why only one port was showing that first time.
At first I could tell that my potentiometer wasn’t talking to p5 (my number wasn’t changing. Did I need to have an arduino sketch uploaded that would read my potentiometer? Oh yes, never uploaded my sketch to the arduino. cool. let’s try that again. YUP. Detective skillz.
Here’s my video of the graphing:
serialCommunication_graph_movie from Zoe Bachman on Vimeo.
Tried out the delay – much choppier, I guess because it’s not gathering data as frequently so there are bigger jumps.
Then I changed it so it would read a string and now there are spaces between the lines. << Not sure I entirely get strings. It’s just a string of bits/bytes? Of different lengths?
Also, why would it read a string that was greater than zero if it said a complete string was every three to six bytes? Shouldn’t it be greater than 3?:
“Remember, the ‘data’ event occurs every time a new byte comes in the serial port. Now that you’re sending an ASCII-encoded string, every potentiometer reading is several bytes long. So you only get a complete string every three to six bytes (three for “0\r\n” and six for “1023\r\n”). Sometimes, when the serialEvent() function calls serial.readStringUntil(‘\r\n’); it gets nothing. That’s when draw() draws the gaps. You need to change your function to check that the resulting string is actually a valid number before you put the string into inData. First, create a local variable to get the string, then check to see if the string’s length is greater than zero. If it is, then put it into inData so that the other functions in the sketch can use the new data. Here’s how you do that:”
Well, got it all to work! yay! I even changed the numbers in the arduino file to get the full 0-1023 range by taking out the mapping. I have to say though, I preferred the sketch when the ranges were 0-255…gave me better control over the graph!
ICM, Wk 6 – DOM DOM DOM DOM…DOM
DOM. Where once I was found, now I’m lost…again.
Slightly?
I mean, conceptually I get a DOM. I also got Marc to explain it a bit more in depth, which was super helpful…conceptually.
I read the chapter in Getting Started and the examples were great…
…and then comes the classic moment where I’m like – BUT WHAT DO I DO WITH THIS NEWFOUND KNOWLEDGE?!
TBH, this is going to be a rough week (though, which week since starting grad school HASN’T been rough?). I think I took this whole “fall break” thing way too seriously.
So, I will be the first to say that I was not terribly ambitious with my ICM homework this week. If this was Project Runway, I’d be in the bottom three. I might even be eliminated.
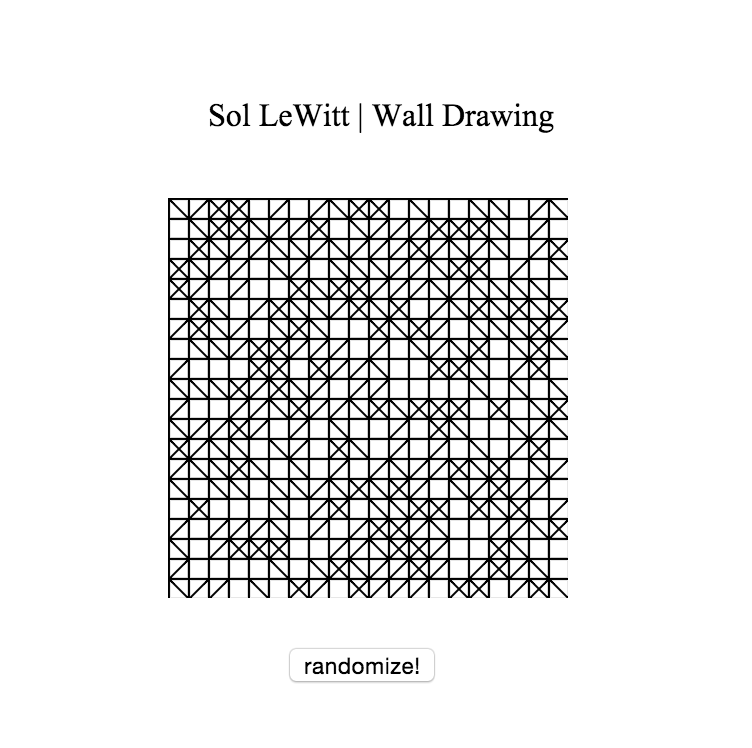
That being said…I thought, why not take that good ol’ Sol LeWitt sketch and see if I can create a button that randomizes it without having to refresh? and YES! Got it! Then I played around with the position of the canvas and the button and gave my little drawing a title.
If I’d given myself more time, I would have also added in the instructions for the drawing. Actually, I did do that and if you notice, I commented them out because I was getting frustrated with formatting the text. One thing I’m not entirely sure about is how to create different styles and formatting with DOM. Is that done within the HTML portion or is that also in the p5.js script? I’m a bit confused as to where certain code elements are supposed to go.
ICM, Wk 4.5: Synthesis Lab
Almost forgot! The Synthesis Lab!
On the whole, I enjoyed the synthesis lab last Friday. I liked the fun-spirited nature of what had previously seemed a quite-daunting task: connecting our arduinos to communciate with p5.js. In PComp last Thursday, Benedetta was very wary of how it would all go, given that p5.js is still very new and there were some things still to be worked out.
Given the “Design Challenge” nature of the lab, particularly the one hour time constraint – there wasn’t much thought given to the idiosyncrasies of p5. It was hard to tell if a problem came from our code or from something else and TBH, me and my partner got to the actual serial communication aspect of our project on the later side.
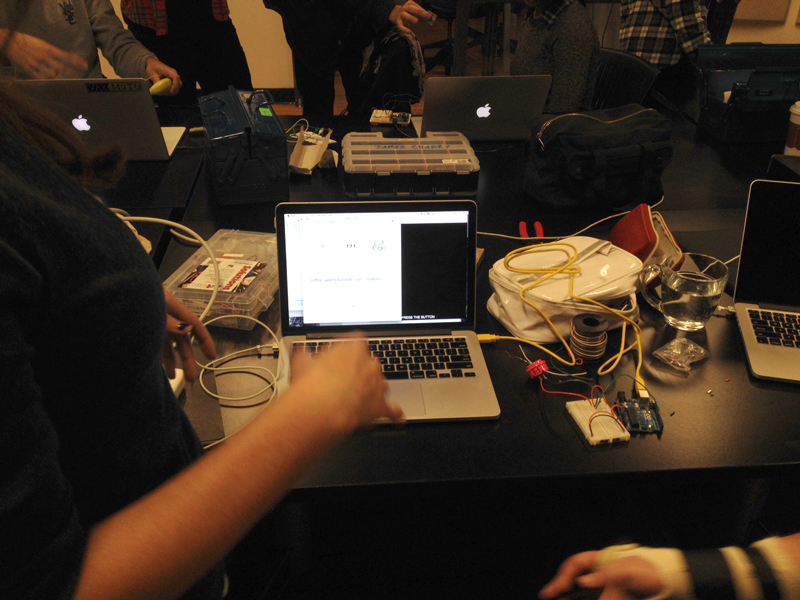
Quick summarization of our idea: We wanted to make a virtual slot machine, where when you pressed a button a combination of images would appear with a related short poem. We had a couple different inspirations, one being a project I did with my art collective in Baltimore: “Baltimore, Take Your Chances”. When we did this project, we tried to hook up a button to manipulate the slot machine, but ended up faking it instead. I wanted to see if we could actually do something like that.
While we were discussing what exactly would emerge form the slot machine, Renata had the idea of Haikus and showed me the work of Rafael Rozendaal. We liked his poems about everyday experiences and objects and thought we could do an interpretation using items from around ITP.
In terms of the coding, we created three arrays of images for the slot machine and three arrays of text for the corresponding poems. What we wanted to happen was that the images would appear like they were spinning/randomizing, then settle on an image and whatever text corresponded would appear below, with randomized verbs and prepositions interspersed to give form and coherence to the sentence.
We got as far as creating our arrays and having them alternate between three different possibilities.
Then we tried to add in a switch to alternate between the states – but realized on the late end that because of the way that our code was written and using a digital input, we could only switch between and “OFF” and an “ON” state, and that whenever it went to the “ON” state, it would only show the first possibility, since when it would turn off it would reset. People who looked at the project later mentioned we could try using analog input or a bounce() function.
Still, pretty happy with what we came up with in about an hour’s time. Would definitely be interested in expanding it more at a later date.
Check out Renata’s post to hear more!
ICM, Wk 5: Got My Grid
I really wanted to get this Sol LeWitt grid down this week. It was killing me. I knew it involved nested loops and some form of multiplication…but I couldn’t figure out when I need nested for loops and exactly where they should go in my code. Would I need them every time I had a for loop in relation to my array?
Played around with the some of the new code we learned in class for creating new objects in arrays – but then I realized I didn’t want to create new objects within the sketch in that way…I just wanted it to repeat them very specifically.
I brought what I had to Shiffman and he let me know that I was on the right track. Mentioned two ways – creating a 2D array</> (two arrays multiplied together, like a matrix!) or creating a really long array and using math to specify the location of an element (like with pixels!.
Went with the first option and ended up with this code:

Now that I had my grid, I wanted to add those other two possible states: a blank square or two intersecting diagonal lines. I messed around with adding “if else” statements and trying to adjustment the number of states…but kept running into issues. I asked second year Marc for some help and..well, things were not working out as he thought they would. Looked like I had accidentally created some infinite loops or something? Well, in the process of debugging I learned some neat tricks – like really using the consol print command to find my issues and how to have multiple cursors appear at once for quick multiple edits. After restarting a few times, trying it out on another computer and working at specifying the states for each if else statement and…then it worked!
 Next, I wanted the squares to change in relation to my cursor location. I knew I would have to use some kind of mouse location specifier, like we did with the roll overs. But I couldn’t get anything to happen. I also played around with the mouseOver() function, but wasn’t getting any results. I saw my friend Renata, who I know to be code savvy, and asked her if she had any idea. Well, whadya know. Renata did a very similar drawing in Week 3 – honestly, I couldn’t have asked a better person. Looking at her code I realized that trying to work with hard coded numbers wasn’t working and that I would need to use my variables. (In retrospect this seems rather obvious, but eh, I’m learning.) Once I got that specific line of code right, I played around with it’s placement to a couple of interesting results. My favorite being:
 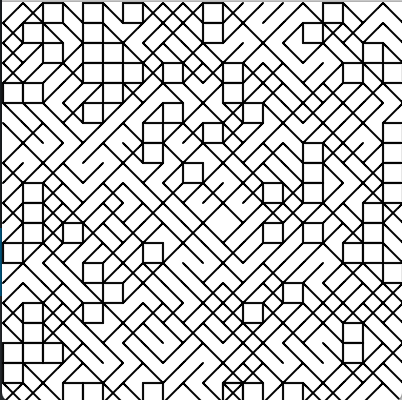 But…I needed my grid. So I found the right spot for it, plus altered some of the code so that each state would give a new result. Except at first I didn’t switch the else state, so it appeared like the blank squares wouldn’t change (because…they didn’t). So I switched around some of the content code and now if you hover the cursor over a square, it changes!
Next Steps:
What I’d like to try and do next is have it so that you can click on a square to alter its state/contents of a square. I tried playing around with the mousePressed function a bit, but wasn’t finding much success.